Meet the Methods Series: Questions to guide quantitative intersectional analyses
Issue 3 Part 2 - October 2021
Greta Bauer, Ph.D., is a Professor of Epidemiology and Biostatistics at Western University and a CIHR Sex and Gender Science Chair. Her Chair aims to identify statistical methods used in intersectional research, to assess how well these methods reflect intersectionality, and to develop best practices for the application of these methods to health data. In part 2 of this two-part series, we spoke with Greta Bauer about intersectional approaches to quantitative data analysis in health research. Best practices in this area are still in development; take a look at Greta Bauer’s review on the topic! This methods sheet will therefore be updated regularly to reflect evolving knowledge. To learn more about intersectionality, quantitative intersectional study design and primary data collection, read part 1 of this issue.

What makes an analysis intersectional?
Intersectional analysis methods allow for each intersection of interest to the study to have its own outcomes and effects. For example, if you are interested in the health outcomes of Black women, then outcomes for this group should be obtained directly from the analysis, instead of summing or multiplying the average outcomes for Black people with those for women. The latter approach assumes that the effects of being Black and of being a woman are independent. This assumption is not intersectional. In an intersectional framework, we assume that the effects of different social identities or positions may be tightly linked and interdependent.
If processes of oppression, discrimination, power and privilege or structural factors like policies are of interest to the study, these variables should also be allowed to have different effects across different intersections. For instance, the effects of ableism on health may unfold differently for people who are disabled and racialized, people who are disabled and gender-diverse, and people who are all three.
Statistical analysis methods are not inherently intersectional; they are only tools. Researchers who want to take an intersectional approach should incorporate an intersectional framework at all stages of the research process. Learn moreFootnote 1.
What questions should researchers ask themselves when developing a quantitative intersectional analysis plan?
Discussions about best practices for quantitative intersectional analyses are still ongoing. The most appropriate analysis approach will depend on the data being used, the intersections being studied, and the research question. Here are a few guiding questions to help develop your analysis pipeline:
- 1. Is your analysis descriptive or analytic?
-
Descriptive analyses allow researchers to describe and characterize inequities across different intersections. This approach is important for highlighting experiences at intersections (including those that are rarely studied), for identifying inequities, and for generating hypotheses. For the simplest example, data could be summarized and plotted at each intersection; this method is called cross-classification.
Analytic analyses can be used to investigate the causal processes or structural contexts that might be generating inequities, allowing for policies and practices which can be intervened upon to be identified. For example, interaction analysisFootnote 2 (also referred to as effect measure modification) allows social intersections to modify the relationship between process variables and the outcomes they may produce.
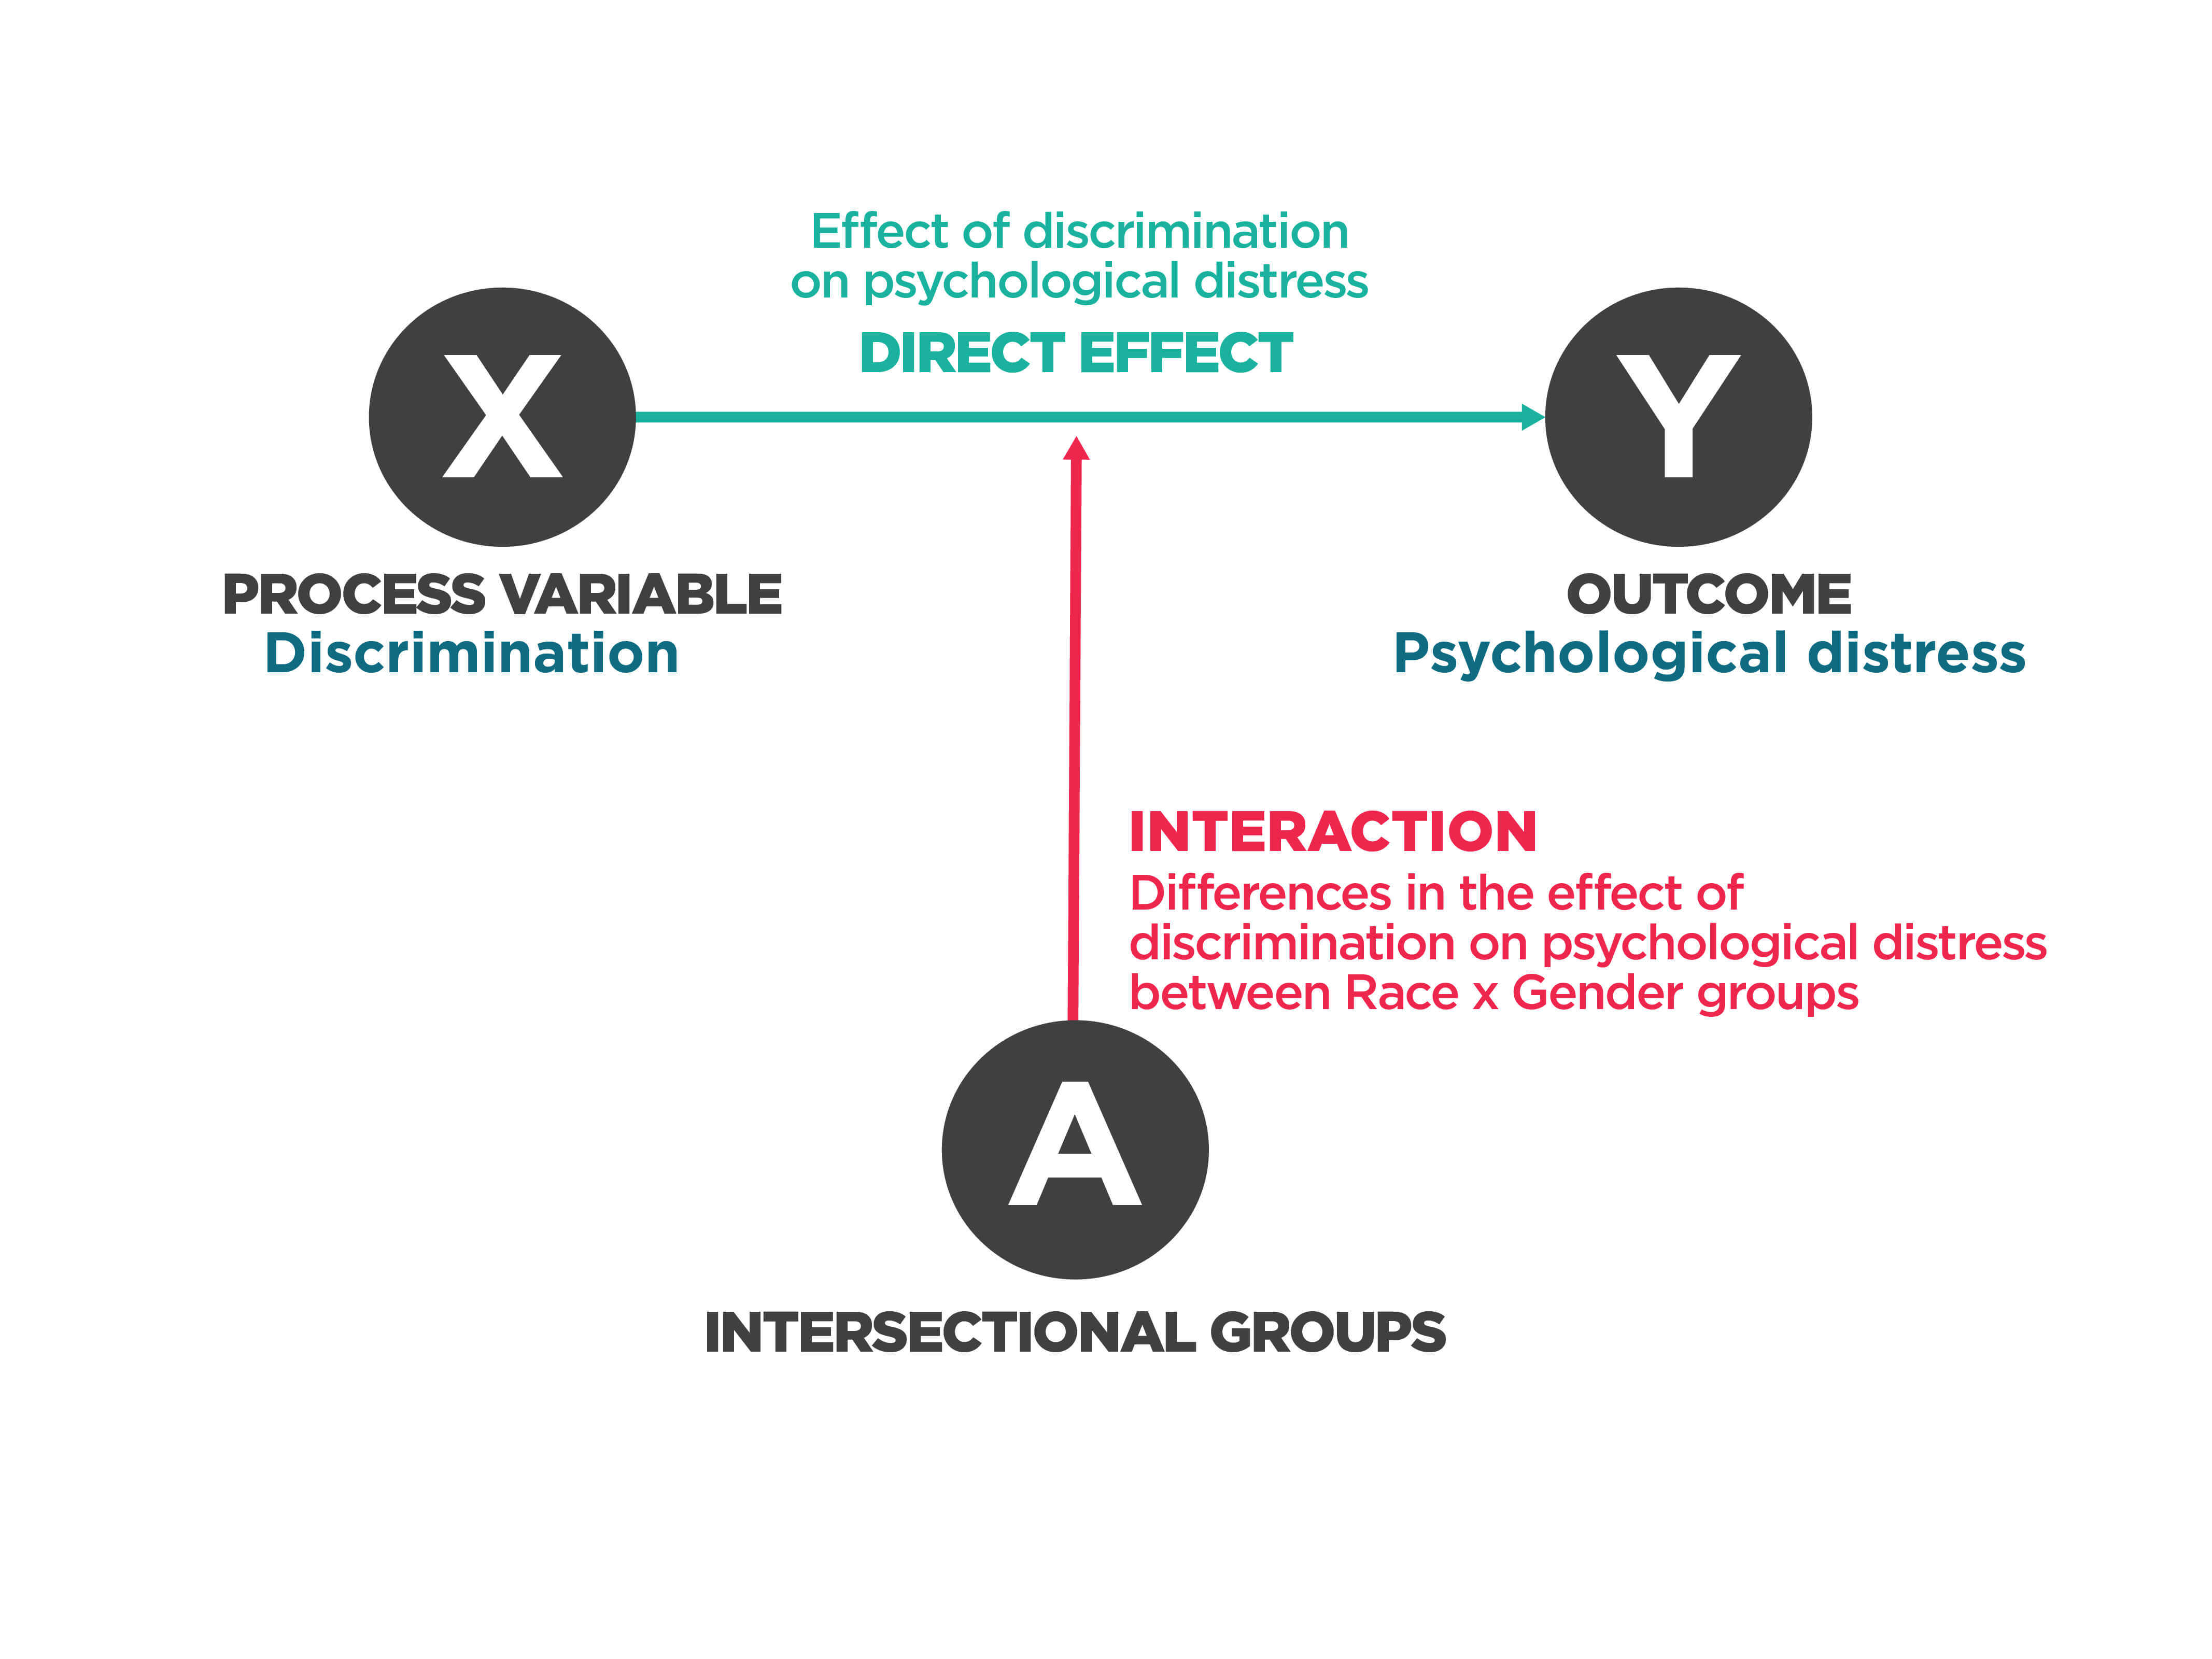
Interaction. Adapted from Bauer & Scheim 2019Footnote 3.
Long description
On the left is an “X” inside a dark gray circle with text that reads “Process variable. Discrimination.”
On the right is a “Y” inside a dark gray circle with text that reads “Outcome. Psychological distress.”
A turquoise arrow extends from “X” to “Y”. Above the turquoise arrow, text reads: “Direct effect. Effect of discrimination on psychological distress.”
Below this arrow is an “A” inside a dark gray circle with text that reads “Intersectional groups. Race x Gender.”
A red arrow extends from “A” to the turquoise arrow connecting “X” and “Y”.
Beside the red arrow, text reads: “Interaction. Differences in the effect of discrimination on psychological distress between Race x Gender groups.”
Interaction can be combined with mediation analysisFootnote 3 to allow the mediating variable to have different effects at each intersection due to different levels of the mediator and different effects of the mediator on the outcome at each intersection. This is sometimes referred to as intersectional mediation decomposition. Learn more about statistical softwareFootnote 4 that can be used to implement intersectional mediation decomposition.
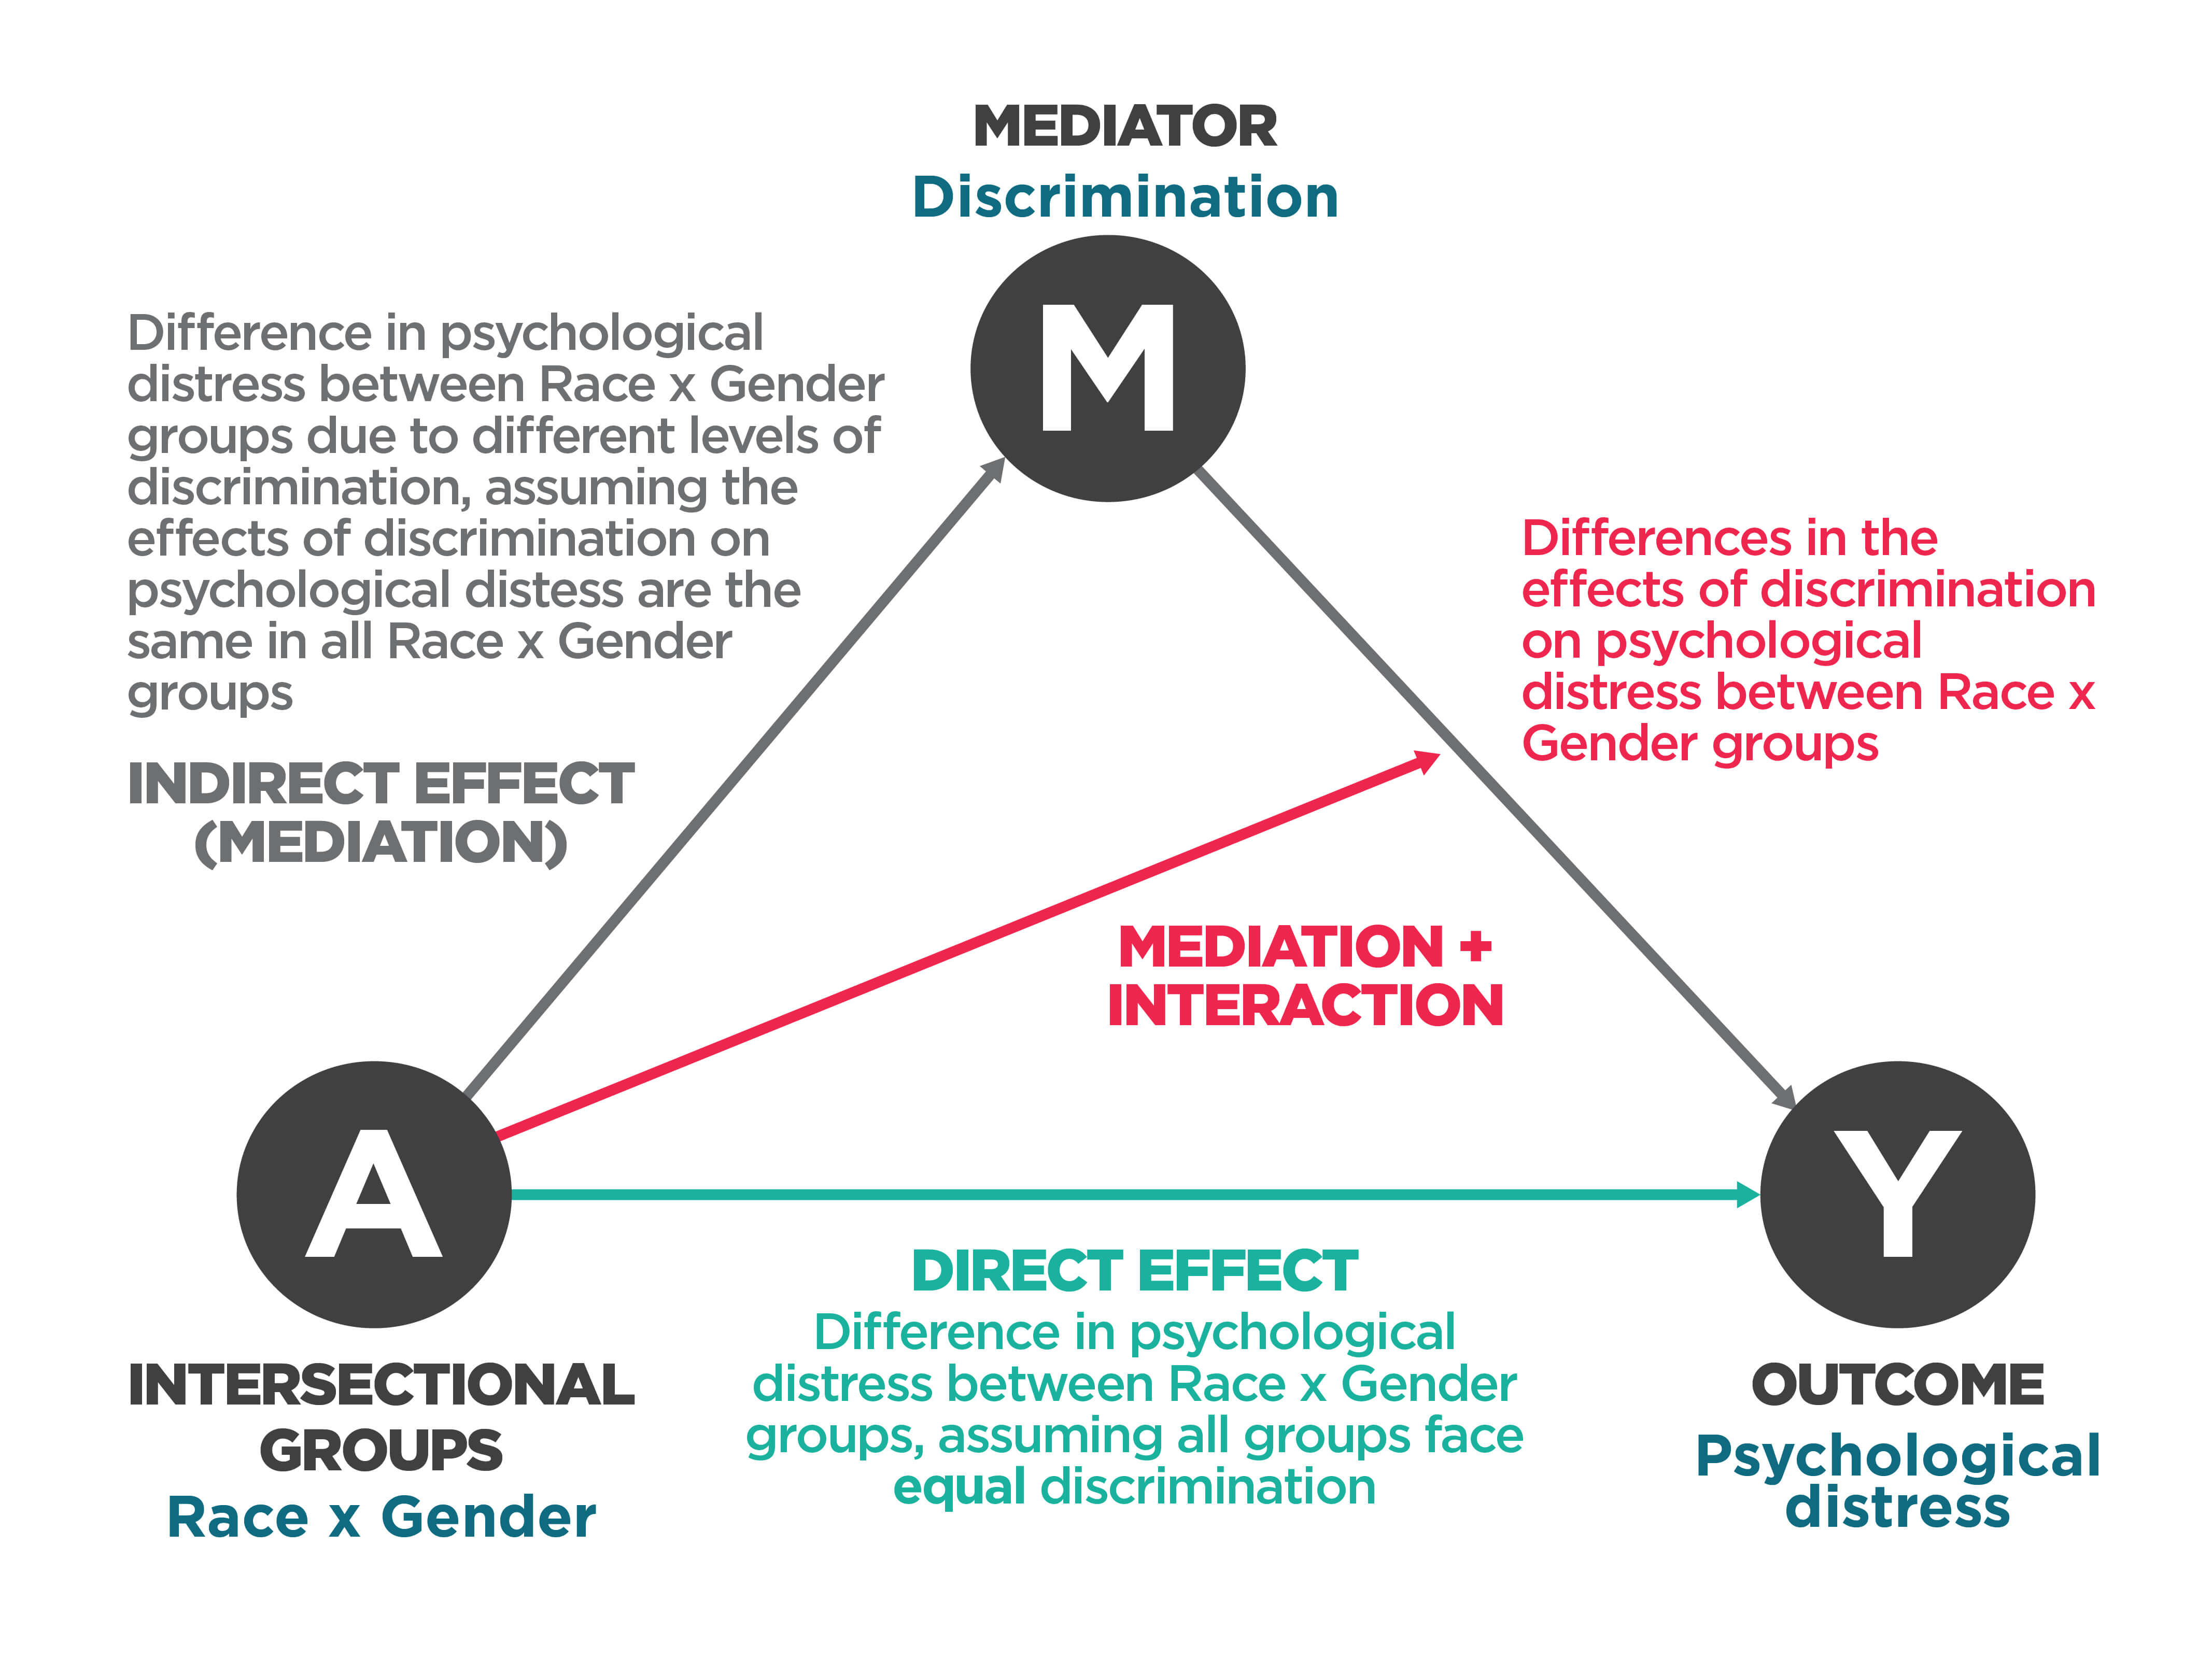
Intersectional mediation decomposition. Adapted from Bauer & Scheim 2019Footnote 3.
Long description
Three dark gray circles connected by arrows are arranged in a triangle.
On the bottom left, the circle reads: “A. Intersectional groups. Race x Gender.”
At the apex, the circle reads: “M. Mediator. Discrimination.”
On the bottom right, the circle reads: “Y. Outcome. Psychological distress.”
A turquoise arrow extends from “A” to “Y”. Below the turquoise arrow, text reads: “Direct effect. Difference in psychological distress between Race x Gender groups, assuming all groups face equal discrimination.”
Gray arrows extend from “A” to “M,” and from “M” to “Y.” Beside one of the gray arrows, text reads: “Indirect effect (mediation). Difference in psychological distress between Race x Gender groups due to different levels of discrimination, assuming the effects of discrimination on psychological distress are the same in all Race x Gender groups.”
A red arrow extends from “A” to the grey arrow connecting “M” and “Y.” Beside the red arrow, text reads: “Mediation + interaction. Differences in effects of discrimination on psychological distress between Race x Gender groups.”
Tip: Early theoretical work in intersectionality used mathematical language as a metaphor. For example, the cumulative effects of intersecting social identities and positions have been described as “multiplicative.” For those familiar with mathematical terminology, it is important to note that intersectional statistical analyses are not multiplicative in a mathematical sense. In fact, additive scales – like those obtained through linear regression – are the most appropriate for conducting intersectional analyses. Learn moreFootnote 2.
- 2. What is the focus of your research question, and what are the roles of social identities, positions, and processes?
-
If your analysis is analytic, consider what the intervenable or modifiable factors are in your analysis. In general, social identities and positions cannot be modified to improve health. Rather, social processes and structural factors can be intervened upon. These factors should be analysed and modeled to provide guidance for interventions.
- 3. How many intersections will be considered?
-
Cross-classification, regression, and all analytic intersectional approaches work better with a small number of intersections (i.e., fewer than a dozen). Decision trees (which automatically segment data using machine learning techniquesFootnote 5) and multilevel modelling with individual-level data can handle highly multidimensional data, where you might have hundreds of intersections. Learn more about different quantitative methodsFootnote 6 and multilevel modellingFootnote 7.
- 4. Do you have nested, multi-level data?
-
If you are using school-level, municipal-level, neighborhood-level or within-subject repeated-measures data, for example, you will want to use multi-level methods.
- 5. Is it important that you produce estimates of precision, like confidence intervals?
-
For example, regression and cross-classification produce estimates of how precise your results are, while machine learning methods do notFootnote 6. Having estimates of precision may be especially important when studying small intersections, which sometimes have imprecise estimates of outcomes and effects.
- 6. Is it important for you to report on within-intersection heterogeneity?
-
If only one central measure is produced for each intersection, there is a risk of misrepresenting the level of similarity among people at that intersection, and overinterpreting average effects. This approach risks attaching health- or disease-related stigma to individuals at an intersection or leading to misguided intervention strategies. Consider documenting and reporting within-intersection heterogeneity.
The views expressed in this document are those of Greta Bauer and do not necessarily reflect those of the CIHR Institute of Gender and Health or the Government of Canada.
- Date modified: