Research Team Size
What the Data Say – March 2026
Historically, scientific discoveries were often solo endeavours, but modern science has evolved into a team sport. This trend is evident in the number of authors on peer-reviewed publications in major academic journals, which has increased significantly over the last century, signaling ever expanding research teamsFootnote 1. In science and engineering, the proportion of publications authored by research teams instead of individuals, steadily increased between 1960 and 2013Footnote 2; the average number of authors on biomedical research publications increased from 3.99 to 6.25 from 2000 to 2020Footnote 3.
While the steady increase in research team size based on authorship on publications is evident, less is known about changes in team sizes on research grant applications. However, one study found that research grants from the National Institutes of Health (NIH) in 2009 supported, on average, 6 part-time or full-time positionsFootnote 4. In the same vein but using an indirect approach, an assessment of authorship on publications supported through NIH grants revealed that the number of authors increased between 1995 and 2017, and larger numbers of authors per article corresponded to relatively more citations for those articles, indicative of influenceFootnote 5 .
We investigated the number of researchers listed on CIHR Project Grant applications to provide insight into CIHR-funded researchers engaging in team science for project development and execution. Specifically, we asked the question: Are CIHR Project Grant team sizes changing over time and do they vary by research pillar and demographic characteristics of nominated principal applicants (NPAs)?
We took the following approach:
- Team size was defined as the number of unique researchers listed on grant applications as NPAs, principal applicants (PAs), or co-applicants (co-As ).
- Applications from Spring 2016 to Fall 2025 competitions were included. An application was considered funded if it received funding in the main Project competition. Additional sources of funding such as bridge grants, Priority Announcements and Prizes were not included.
- The gender of the NPA was determined using the responses to the self-identification questionnaire, first introduced to the CIHR’s Project Grant in 2018. The questionnaire was revised in 2022 to allow an individual to self-identify with more than one gender, and each application was counted in the relevant gender group(s).
Project Grant application team size from Spring 2016 to Fall 2025
Overall, the average team size on Project Grant applications increased from 3.95 researchers in Spring 2016 to 5.92 researchers in Fall 2025 (Figure 1, Table 1). The mean team size for funded applications was slightly higher and increased from 4.63 to 6.65 during the same period, compared to that for unfunded applications, which increased from 3.86 to 5.81.
Figure 1: Average Project Grant application team size
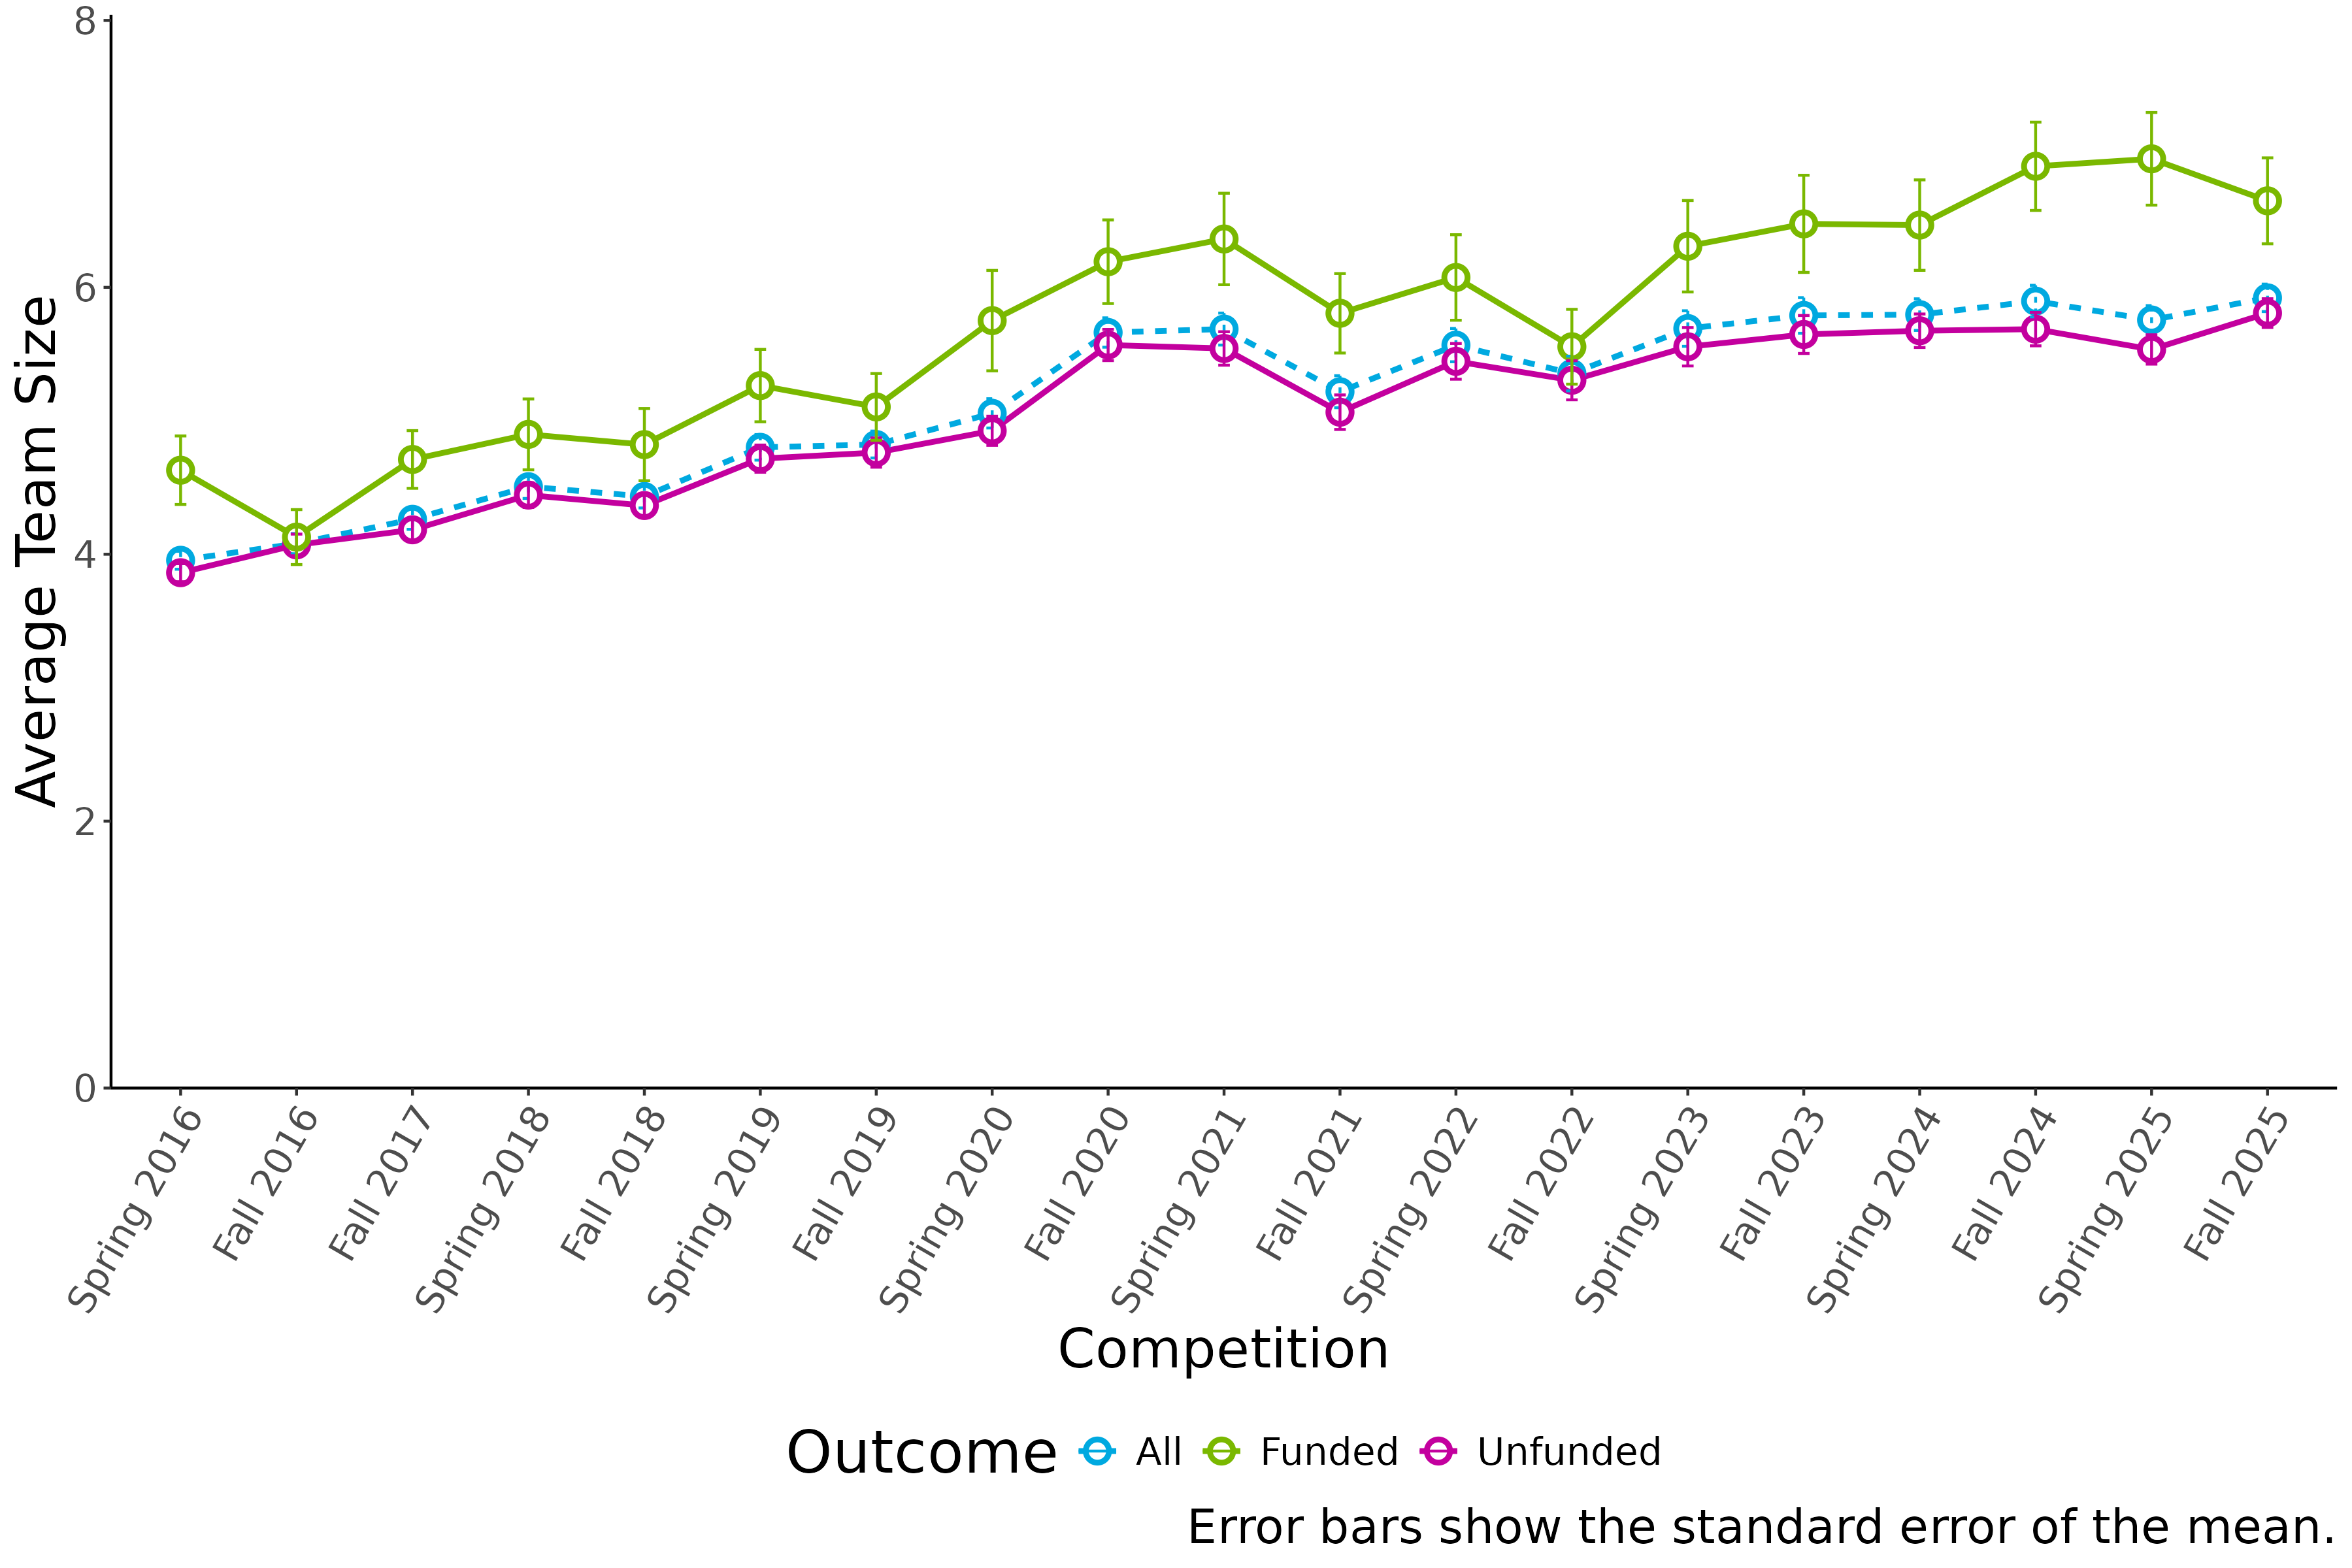
Figure 1 – Long Description
| Outcome | Spring 2016 | Fall 2016 | Fall 2017 | Spring 2018 | Fall 2018 | Spring 2019 | Fall 2019 | Spring 2020 | Fall 2020 | Spring 2021 | Fall 2021 | Spring 2022 | Fall 2022 | Spring 2023 | Fall 2023 | Spring 2024 | Fall 2024 | Spring 2025 | Fall 2025 | All Competitions |
|---|---|---|---|---|---|---|---|---|---|---|---|---|---|---|---|---|---|---|---|---|
| All | 3.95±0.07 (3,813) |
4.08±0.08 (2,884) |
4.26±0.08 (3,415) |
4.51±0.09 (2,633) |
4.43±0.09 (2,484) |
4.8±0.1 (2,445) |
4.82±0.1 (2,183) |
5.06±0.11 (2,131) |
5.66±0.11 (2,358) |
5.69±0.12 (2,381) |
5.22±0.12 (2,014) |
5.57±0.12 (2,095) |
5.35±0.13 (1,899) |
5.69±0.13 (2,113) |
5.79±0.13 (2,175) |
5.8±0.12 (2,443) |
5.9±0.12 (2,631) |
5.76±0.11 (2,814) |
5.92±0.1 (3,101) |
5.11±0.02 (48,012) |
| Funded | 4.63±0.26 (462) |
4.13±0.21 (474) |
4.71±0.22 (511) |
4.9±0.27 (364) |
4.82±0.27 (370) |
5.26±0.27 (379) |
5.1±0.25 (384) |
5.75±0.38 (337) |
6.19±0.31 (354) |
6.36±0.34 (422) |
5.81±0.3 (417) |
6.07±0.32 (405) |
5.55±0.28 (382) |
6.31±0.34 (383) |
6.48±0.36 (374) |
6.47±0.34 (373) |
6.91±0.33 (453) |
6.96±0.35 (435) |
6.65±0.32 (421) |
5.72±0.07 (7,700) |
| Unfunded | 3.86±0.07 (3,351) |
4.07±0.08 (2,410) |
4.18±0.08 (2,904) |
4.44±0.09 (2,269) |
4.37±0.09 (2,114) |
4.72±0.1 (2,066) |
4.76±0.11 (1,799) |
4.93±0.11 (1,794) |
5.57±0.12 (2,004) |
5.54±0.13 (1,959) |
5.06±0.13 (1,597) |
5.45±0.13 (1,690) |
5.3±0.15 (1,517) |
5.55±0.14 (1,730) |
5.65±0.14 (1,801) |
5.67±0.13 (2,070) |
5.69±0.12 (2,178) |
5.53±0.11 (2,379) |
5.81±0.11 (2,680) |
4.99±0.03 (40,312) |
|
Data is shown as mean ± standard error of the mean. |
||||||||||||||||||||
Project Grant application team size by research pillar
CIHR defines four pillars of health research, and for the Project Grant competition applicants self-select the research pillar for their application.
Average team sizes (Figure 2, Table 2) were larger for the HSS (Health Systems and Services; range: 8.77–12.06), Clinical (range: 6.7–10.34), and SCEP (Social, Cultural, Environmental, and Population Health; range 7–9.43) pillars compared to Biomedical (range: 2.27–2.82). Except for the Biomedical pillar, between Spring 2016 and Fall 2025, funded teams tended to be larger than unfunded teams across all pillars. This pattern was strongest for the Clinical and HSS pillars. The noticeable increase of team size for the Clinical pillar was in agreement with the striking 97% increase in the mean number of authors found for published clinical trials between 2000 and 2020Footnote 3, although clinical research funded by CIHR is not limited to clinical trials.
Note: Applications with no research pillar specified were excluded, representing 0.19% of applications.
Figure 2: Average Project Grant application team size by research pillar
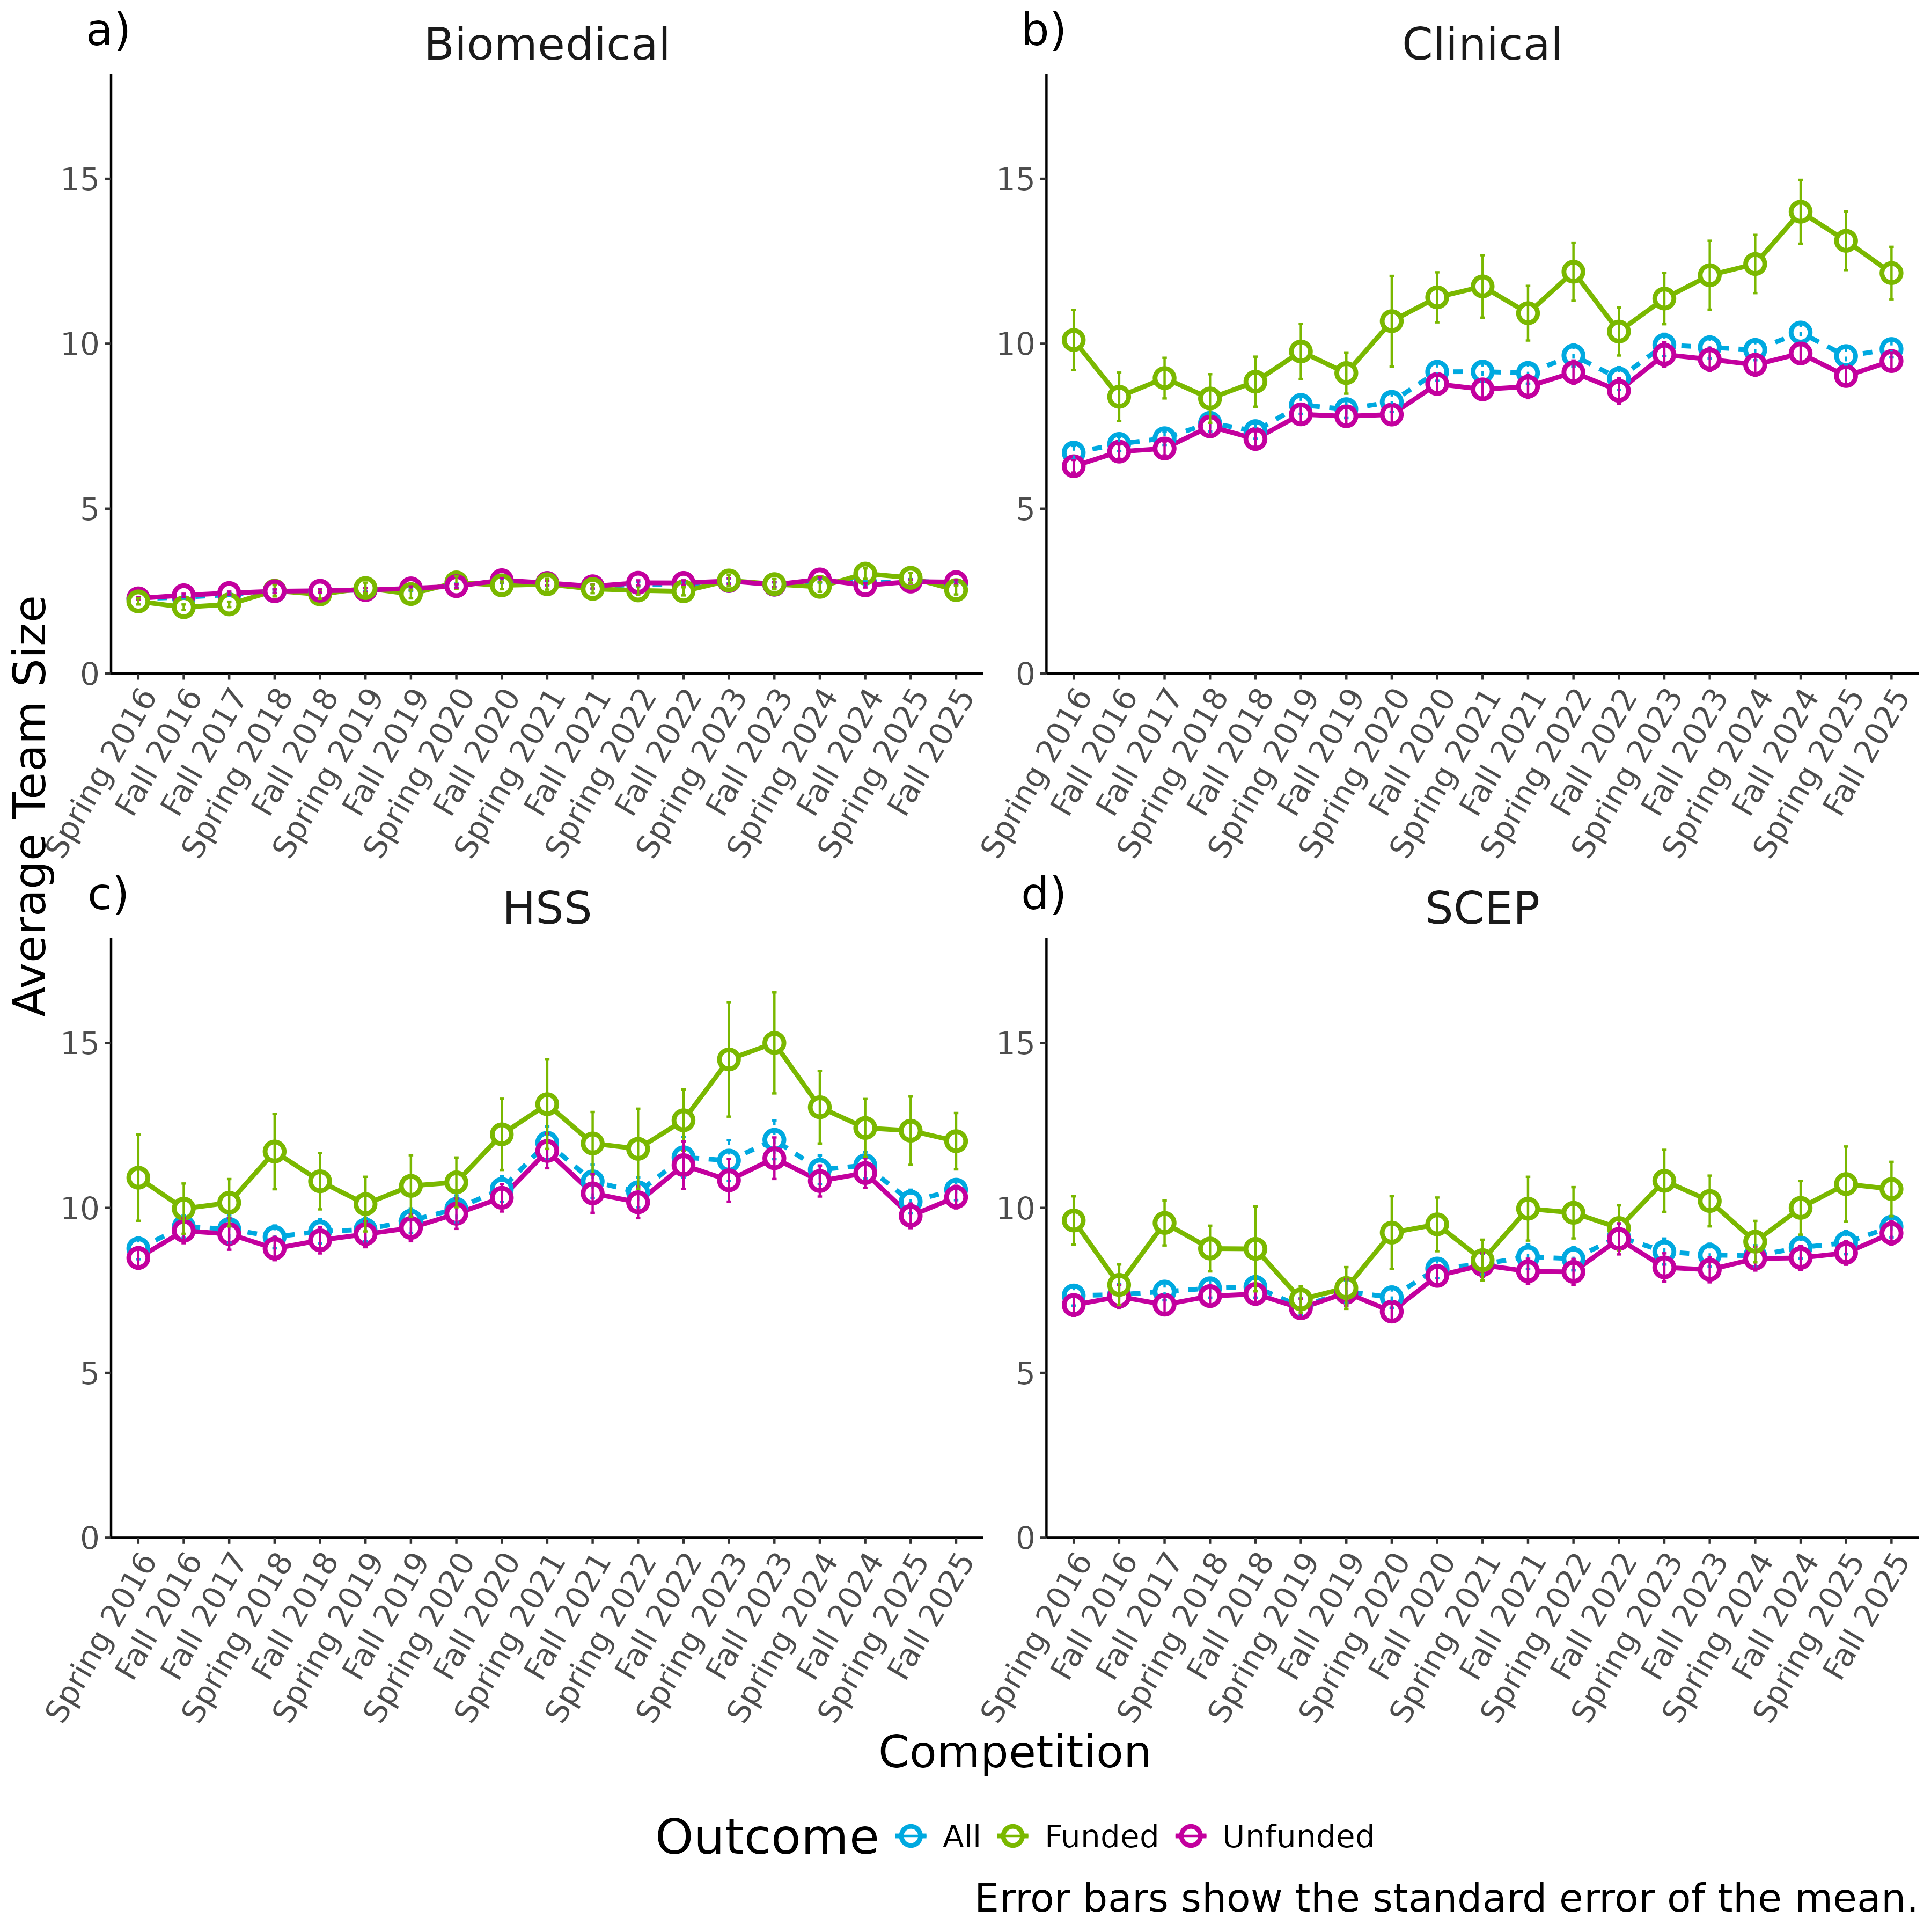
Figure 2 – Long Description
| Research Pillar | Outcome | Spring 2016 | Fall 2016 | Fall 2017 | Spring 2018 | Fall 2018 | Spring 2019 | Fall 2019 | Spring 2020 | Fall 2020 | Spring 2021 | Fall 2021 | Spring 2022 | Fall 2022 | Spring 2023 | Fall 2023 | Spring 2024 | Fall 2024 | Spring 2025 | Fall 2025 | All Competitions |
|---|---|---|---|---|---|---|---|---|---|---|---|---|---|---|---|---|---|---|---|---|---|
| Biomedical | All | 2.27±0.03 (2,540) |
2.31±0.04 (1,932) |
2.39±0.04 (2,216) |
2.5±0.05 (1,650) |
2.49±0.05 (1,586) |
2.54±0.05 (1,456) |
2.55±0.05 (1,322) |
2.67±0.06 (1,240) |
2.81±0.06 (1,311) |
2.74±0.06 (1,358) |
2.63±0.06 (1,237) |
2.71±0.06 (1,216) |
2.7±0.07 (1,164) |
2.81±0.08 (1,260) |
2.7±0.07 (1,266) |
2.82±0.06 (1,404) |
2.74±0.06 (1,512) |
2.81±0.06 (1,589) |
2.74±0.05 (1,726) |
2.6±0.01 (28,985) |
| Biomedical | Funded | 2.19±0.09 (321) |
2.01±0.08 (323) |
2.1±0.08 (327) |
2.51±0.17 (232) |
2.4±0.13 (240) |
2.59±0.16 (224) |
2.41±0.13 (229) |
2.76±0.2 (203) |
2.67±0.12 (206) |
2.71±0.16 (240) |
2.57±0.13 (256) |
2.52±0.13 (242) |
2.49±0.12 (237) |
2.82±0.17 (236) |
2.71±0.16 (225) |
2.63±0.15 (213) |
3.03±0.16 (266) |
2.9±0.15 (248) |
2.53±0.13 (232) |
2.53±0.03 (4,700) |
| Biomedical | Unfunded | 2.28±0.04 (2,219) |
2.37±0.05 (1,609) |
2.44±0.04 (1,889) |
2.5±0.05 (1,418) |
2.51±0.06 (1,346) |
2.53±0.06 (1,232) |
2.58±0.06 (1,093) |
2.65±0.06 (1,037) |
2.83±0.07 (1,105) |
2.75±0.07 (1,118) |
2.65±0.07 (981) |
2.75±0.07 (974) |
2.75±0.08 (927) |
2.81±0.08 (1,024) |
2.7±0.07 (1,041) |
2.85±0.07 (1,191) |
2.67±0.06 (1,246) |
2.79±0.06 (1,341) |
2.77±0.06 (1,494) |
2.61±0.01 (24,285) |
| Clinical | All | 6.7±0.2 (666) |
6.96±0.21 (493) |
7.14±0.2 (629) |
7.6±0.26 (515) |
7.35±0.23 (481) |
8.14±0.27 (508) |
8.02±0.27 (446) |
8.24±0.31 (465) |
9.15±0.27 (526) |
9.15±0.3 (528) |
9.11±0.33 (424) |
9.64±0.34 (458) |
8.94±0.34 (381) |
9.96±0.34 (438) |
9.89±0.34 (460) |
9.81±0.31 (523) |
10.34±0.31 (583) |
9.62±0.27 (632) |
9.84±0.25 (673) |
8.7±0.07 (9,829) |
| Clinical | Funded | 10.11±0.91 (72) |
8.39±0.73 (69) |
8.96±0.62 (92) |
8.34±0.74 (65) |
8.85±0.76 (66) |
9.76±0.83 (76) |
9.11±0.62 (73) |
10.68±1.37 (63) |
11.41±0.76 (74) |
11.74±0.95 (91) |
10.92±0.83 (79) |
12.18±0.88 (77) |
10.37±0.73 (79) |
11.37±0.78 (76) |
12.08±1.04 (66) |
12.42±0.88 (77) |
14±0.97 (86) |
13.12±0.89 (93) |
12.14±0.8 (92) |
10.93±0.2 (1,466) |
| Clinical | Unfunded | 6.28±0.19 (594) |
6.73±0.22 (424) |
6.82±0.21 (537) |
7.49±0.28 (450) |
7.11±0.23 (415) |
7.86±0.28 (432) |
7.8±0.3 (373) |
7.85±0.28 (402) |
8.78±0.29 (452) |
8.62±0.3 (437) |
8.7±0.35 (345) |
9.13±0.36 (381) |
8.57±0.39 (302) |
9.67±0.37 (362) |
9.53±0.35 (394) |
9.36±0.33 (446) |
9.7±0.32 (497) |
9.02±0.27 (539) |
9.47±0.26 (581) |
8.3±0.07 (8,363) |
| HSS | All | 8.77±0.33 (296) |
9.43±0.34 (233) |
9.36±0.42 (280) |
9.12±0.35 (200) |
9.29±0.36 (205) |
9.34±0.36 (231) |
9.61±0.37 (225) |
9.97±0.41 (200) |
10.57±0.39 (251) |
11.97±0.49 (239) |
10.8±0.5 (174) |
10.47±0.45 (203) |
11.53±0.61 (165) |
11.43±0.62 (196) |
12.06±0.59 (219) |
11.16±0.43 (255) |
11.29±0.4 (260) |
10.19±0.36 (298) |
10.55±0.32 (363) |
10.33±0.1 (4,493) |
| HSS | Funded | 10.91±1.31 (35) |
9.98±0.76 (43) |
10.16±0.72 (45) |
11.71±1.14 (24) |
10.81±0.85 (31) |
10.11±0.83 (35) |
10.67±0.93 (39) |
10.77±0.75 (31) |
12.23±1.08 (35) |
13.14±1.36 (42) |
11.95±0.95 (42) |
11.79±1.22 (38) |
12.66±0.93 (29) |
14.5±1.73 (32) |
15±1.53 (35) |
13.05±1.1 (39) |
12.42±0.88 (45) |
12.34±1.03 (50) |
12.02±0.85 (48) |
11.89±0.25 (718) |
| HSS | Unfunded | 8.48±0.32 (261) |
9.31±0.38 (190) |
9.21±0.48 (235) |
8.77±0.35 (176) |
9.02±0.4 (174) |
9.2±0.4 (196) |
9.39±0.4 (186) |
9.82±0.46 (169) |
10.31±0.42 (216) |
11.73±0.52 (197) |
10.44±0.59 (132) |
10.17±0.48 (165) |
11.29±0.72 (136) |
10.84±0.65 (164) |
11.51±0.63 (184) |
10.81±0.47 (216) |
11.06±0.45 (215) |
9.76±0.37 (248) |
10.33±0.34 (315) |
10.03±0.11 (3,775) |
| SCEP | All | 7.34±0.3 (303) |
7.37±0.31 (226) |
7.46±0.26 (287) |
7.56±0.28 (261) |
7.6±0.32 (210) |
7±0.25 (248) |
7.46±0.34 (187) |
7.29±0.32 (221) |
8.16±0.29 (266) |
8.3±0.31 (250) |
8.52±0.37 (172) |
8.46±0.35 (212) |
9.12±0.4 (187) |
8.68±0.39 (213) |
8.57±0.35 (225) |
8.55±0.32 (253) |
8.8±0.34 (271) |
8.94±0.35 (289) |
9.43±0.32 (335) |
8.15±0.08 (4,616) |
| SCEP | Funded | 9.62±0.73 (34) |
7.67±0.62 (39) |
9.54±0.68 (46) |
8.77±0.69 (43) |
8.76±1.29 (33) |
7.23±0.4 (44) |
7.57±0.63 (42) |
9.25±1.1 (40) |
9.5±0.81 (38) |
8.42±0.62 (48) |
9.97±0.97 (40) |
9.85±0.78 (47) |
9.39±0.69 (36) |
10.82±0.94 (39) |
10.21±0.77 (48) |
8.98±0.63 (43) |
10±0.81 (56) |
10.72±1.14 (43) |
10.57±0.82 (49) |
9.33±0.19 (808) |
| SCEP | Unfunded | 7.06±0.33 (269) |
7.31±0.36 (187) |
7.07±0.28 (241) |
7.33±0.31 (218) |
7.39±0.3 (177) |
6.96±0.29 (204) |
7.43±0.4 (145) |
6.86±0.29 (181) |
7.94±0.31 (228) |
8.27±0.36 (202) |
8.08±0.38 (132) |
8.06±0.39 (165) |
9.06±0.47 (151) |
8.2±0.43 (174) |
8.12±0.38 (177) |
8.46±0.36 (210) |
8.48±0.37 (215) |
8.63±0.36 (246) |
9.23±0.35 (286) |
7.9±0.08 (3,808) |
| Overall | Overall | 3.95±0.07 (3,805) |
4.08±0.08 (2,884) |
4.26±0.08 (3,412) |
4.51±0.09 (2,626) |
4.43±0.09 (2,482) |
4.8±0.1 (2,443) |
4.82±0.1 (2,180) |
5.05±0.11 (2,126) |
5.66±0.11 (2,354) |
5.68±0.12 (2,375) |
5.21±0.12 (2,007) |
5.57±0.12 (2,089) |
5.35±0.13 (1,897) |
5.69±0.13 (2,107) |
5.78±0.13 (2,170) |
5.79±0.12 (2,435) |
5.9±0.12 (2,626) |
5.76±0.11 (2,808) |
5.92±0.1 (3,097) |
5.11±0.02 (47,923) |
|
Data is shown as mean ± standard error of the mean. |
|||||||||||||||||||||
Project Grant application team size by gender
Across most competitions, women NPAs had larger teams (range: 5.36–7.34) on average than men (range: 4.01–5.3; Figure 3, Table 3). For both men and women NPAs, the average size of funded teams was slightly larger than for unfunded teams and there was a trend of increasing team size from Fall 2018 to Fall 2025.
Note: All NPAs who selected the gender identity options “Man” or “Woman”, irrespective of any other options selected, were counted in the respective groups in line with current CIHR reporting methodology. Data were not shown for the other responses, including ‘I prefer not to answer’ and ‘gender diverse’ (including all other gender identity options selected), in compliance with CIHR’s data use and sharing policies for self-identification data to protect the privacy of individuals.
Figure 3: Average Project Grant application team size by gender
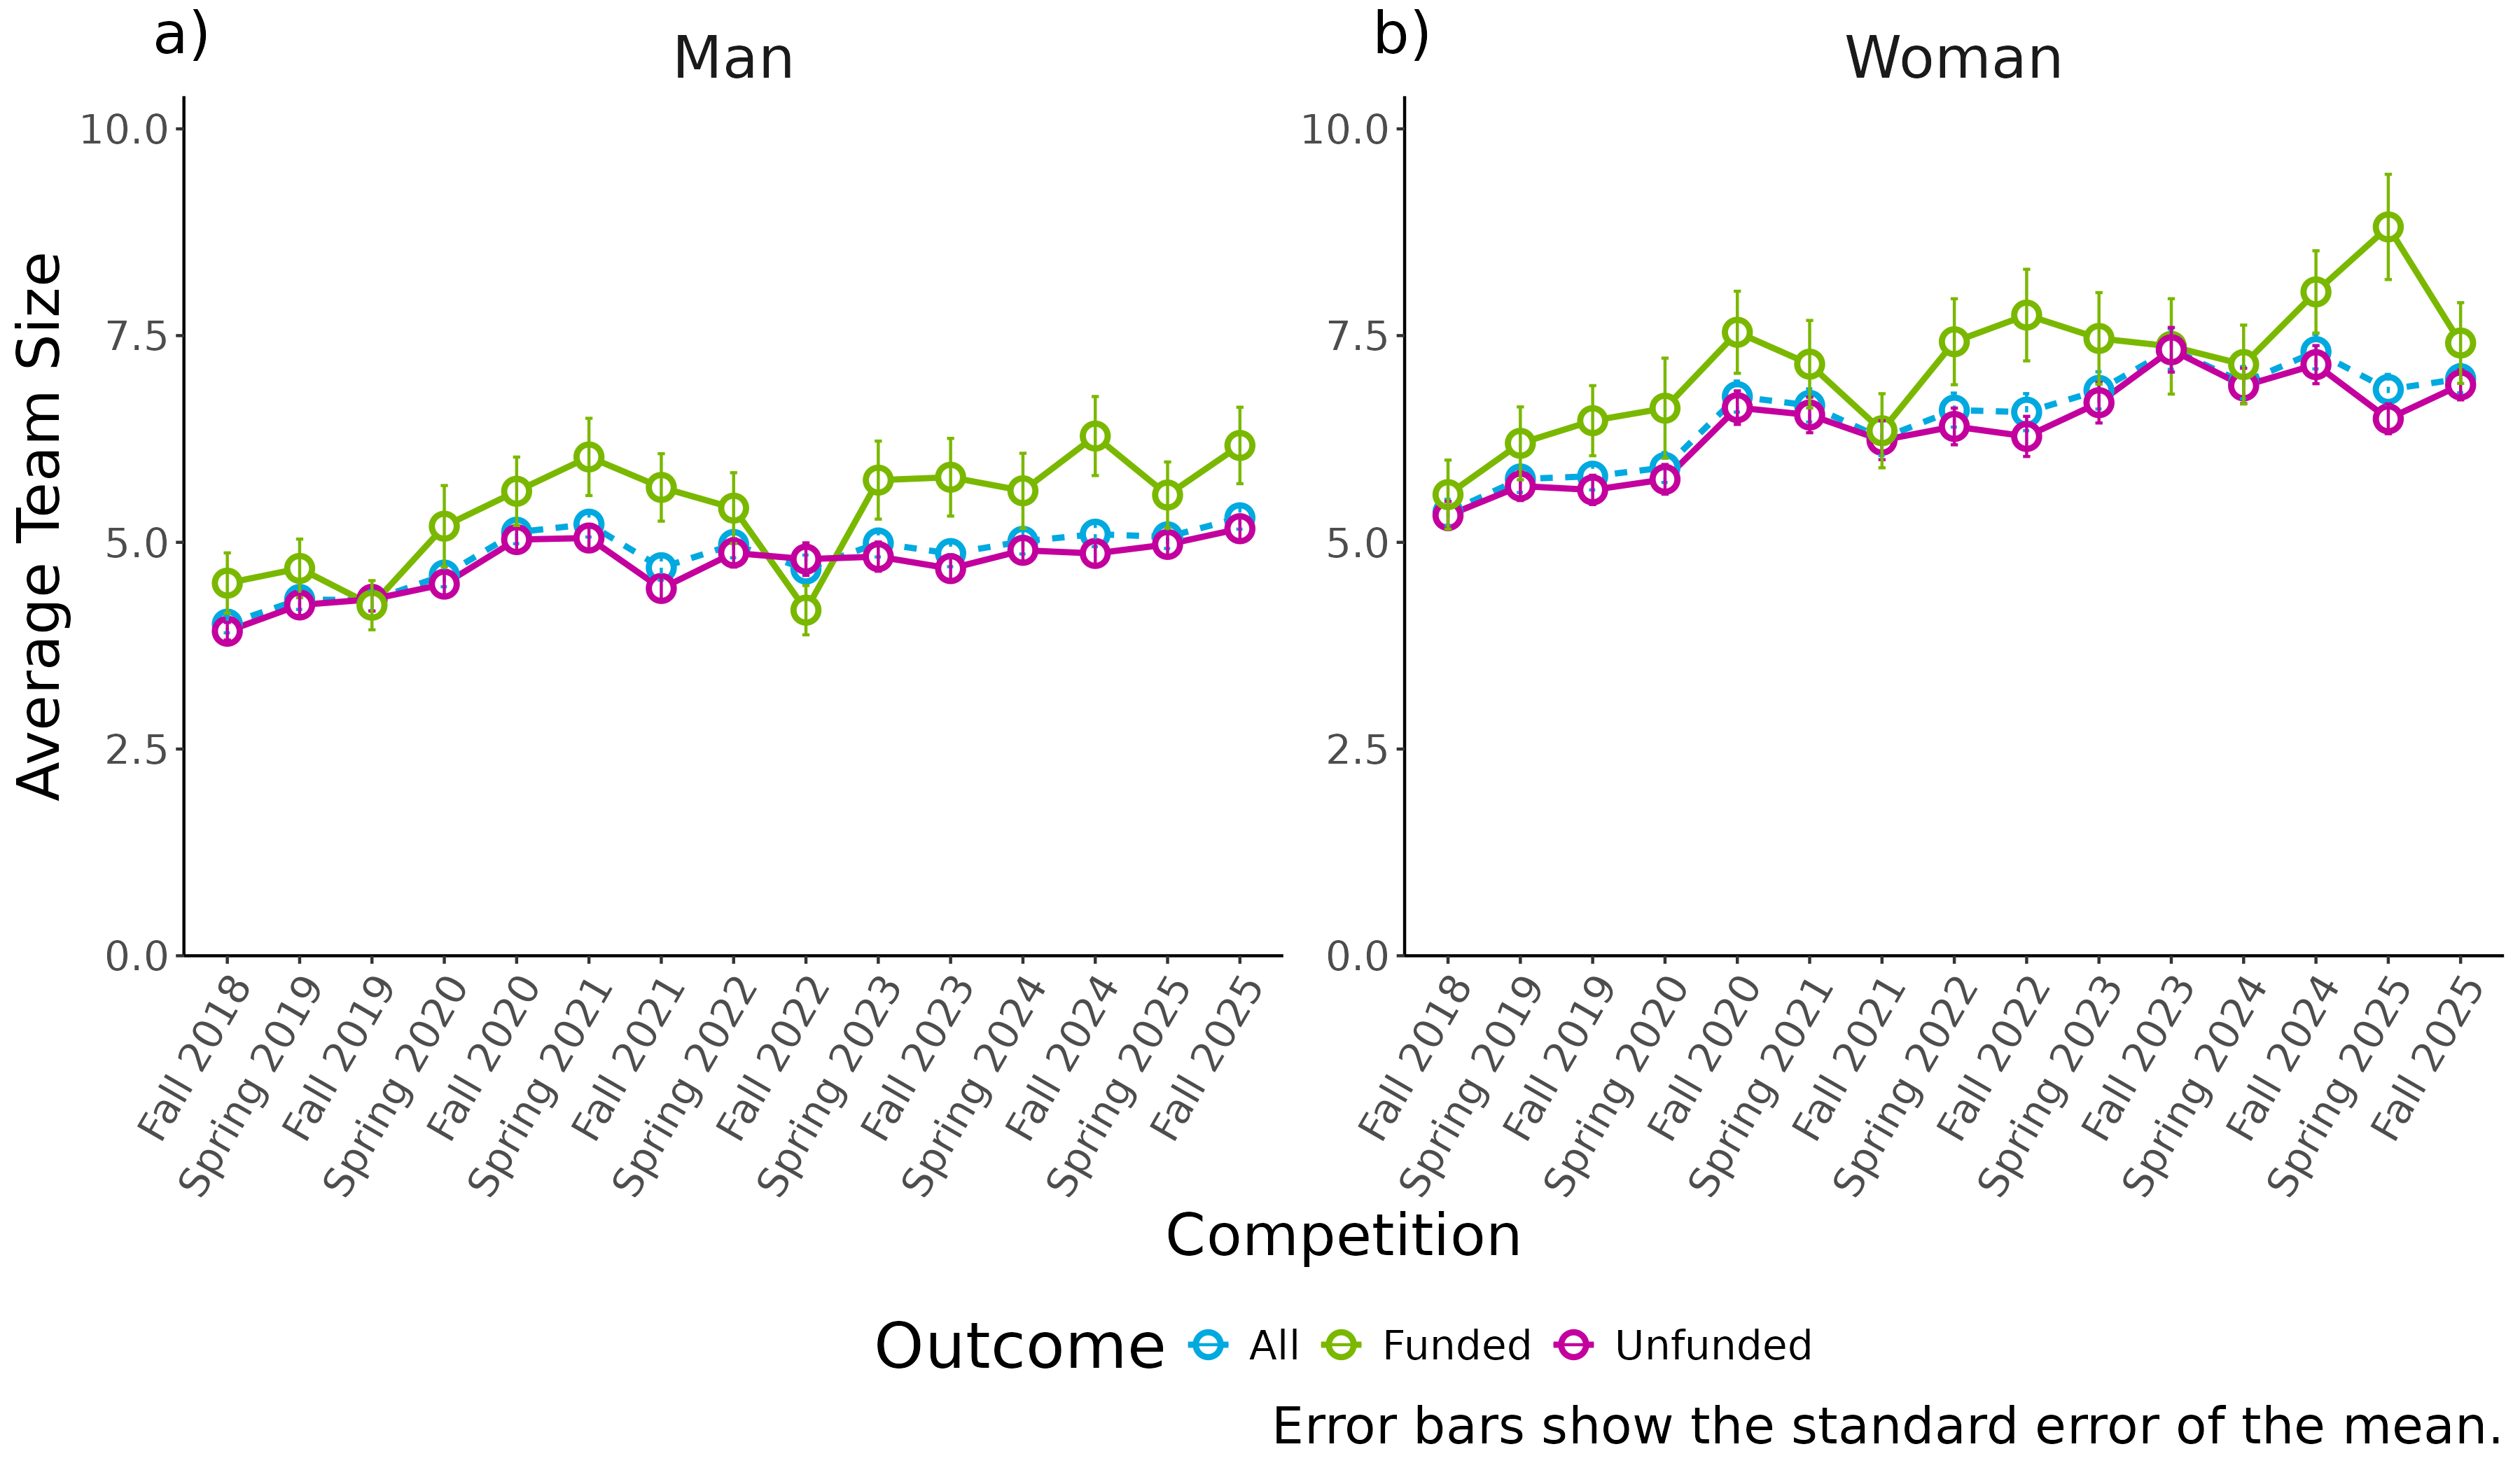
Figure 3 – Long Description
| NPA Gender | Outcome | Fall 2018 | Spring 2019 | Fall 2019 | Spring 2020 | Fall 2020 | Spring 2021 | Fall 2021 | Spring 2022 | Fall 2022 | Spring 2023 | Fall 2023 | Spring 2024 | Fall 2024 | Spring 2025 | Fall 2025 | All Competitions |
|---|---|---|---|---|---|---|---|---|---|---|---|---|---|---|---|---|---|
| Man | All | 4.01±0.11 (1,542) |
4.31±0.12 (1,498) |
4.3±0.13 (1,318) |
4.6±0.14 (1,280) |
5.12±0.14 (1,424) |
5.22±0.16 (1,434) |
4.69±0.15 (1,245) |
4.97±0.16 (1,256) |
4.68±0.17 (1,062) |
4.99±0.17 (1,189) |
4.86±0.16 (1,228) |
5.01±0.15 (1,317) |
5.1±0.15 (1,433) |
5.07±0.14 (1,496) |
5.3±0.14 (1,644) |
4.82±0.04 (20,366) |
| Man | Funded | 4.51±0.37 (227) |
4.68±0.35 (225) |
4.24±0.3 (217) |
5.2±0.49 (200) |
5.62±0.41 (217) |
6.03±0.47 (245) |
5.66±0.41 (256) |
5.41±0.43 (237) |
4.18±0.3 (206) |
5.75±0.47 (210) |
5.79±0.47 (202) |
5.62±0.45 (199) |
6.29±0.48 (235) |
5.57±0.4 (229) |
6.17±0.46 (216) |
5.39±0.11 (3,321) |
| Man | Unfunded | 3.92±0.11 (1,315) |
4.24±0.13 (1,273) |
4.31±0.14 (1,101) |
4.49±0.14 (1,080) |
5.03±0.15 (1,207) |
5.05±0.16 (1,189) |
4.44±0.16 (989) |
4.87±0.17 (1,019) |
4.8±0.2 (856) |
4.83±0.18 (979) |
4.68±0.17 (1,026) |
4.9±0.16 (1,118) |
4.87±0.15 (1,198) |
4.97±0.15 (1,267) |
5.16±0.14 (1,428) |
4.71±0.04 (17,045) |
| Woman | All | 5.36±0.16 (851) |
5.77±0.16 (859) |
5.8±0.17 (786) |
5.9±0.18 (765) |
6.76±0.19 (843) |
6.66±0.2 (860) |
6.26±0.21 (704) |
6.6±0.21 (766) |
6.57±0.22 (695) |
6.84±0.23 (763) |
7.34±0.24 (765) |
6.93±0.19 (927) |
7.31±0.21 (982) |
6.85±0.18 (1,093) |
6.98±0.17 (1,201) |
6.56±0.05 (12,860) |
| Woman | Funded | 5.58±0.42 (130) |
6.2±0.44 (142) |
6.47±0.42 (155) |
6.62±0.61 (127) |
7.54±0.5 (124) |
7.15±0.53 (162) |
6.35±0.45 (146) |
7.43±0.52 (148) |
7.75±0.55 (139) |
7.47±0.55 (146) |
7.37±0.58 (138) |
7.15±0.48 (140) |
8.03±0.5 (176) |
8.81±0.64 (167) |
7.41±0.49 (178) |
7.19±0.13 (2,218) |
| Woman | Unfunded | 5.32±0.17 (721) |
5.68±0.18 (717) |
5.63±0.18 (631) |
5.76±0.18 (638) |
6.63±0.2 (719) |
6.54±0.21 (698) |
6.23±0.24 (558) |
6.4±0.22 (618) |
6.28±0.24 (556) |
6.69±0.25 (617) |
7.33±0.27 (627) |
6.89±0.21 (787) |
7.15±0.23 (806) |
6.49±0.18 (926) |
6.9±0.18 (1,023) |
6.43±0.05 (10,642) |
| Overall | Overall | 4.49±0.09 (2,393) |
4.84±0.1 (2,357) |
4.86±0.1 (2,104) |
5.09±0.11 (2,045) |
5.73±0.11 (2,267) |
5.76±0.12 (2,294) |
5.26±0.12 (1,949) |
5.59±0.13 (2,022) |
5.43±0.14 (1,757) |
5.71±0.14 (1,952) |
5.81±0.14 (1,993) |
5.8±0.12 (2,244) |
6±0.13 (2,415) |
5.82±0.11 (2,589) |
6.01±0.11 (2,845) |
5.49±0.03 (33,226) |
|
Data is shown as mean ± standard error of the mean. |
|||||||||||||||||
Project Grant application team size by career stage
For NPAs at all career stages, there was a trend of increasing team size between Spring 2016 and Fall 2025 and a trend of larger team size for funded compared to unfunded applications (Figure 4, Table 4). Further, early career researchers (ECRs; range: 4.41–6.94) and mid-career researchers (MCRs, range: 3.95–6.5) had slightly larger teams than senior career researchers (SCRs; range: 3.63–5.04) and the difference in size between funded and unfunded teams was slightly larger for ECRs and MCRs compared to SCRs.
Note: Other career stages, such as where the NPA is a Knowledge User, were excluded, representing 0.22% of applications. MCR and SCR status were self-reported and not verified, while ECR status was verified at the time of application for applicants self-reported as ECR up to the Spring 2025 competition and was self-reported for the Fall 2025 competition.
Figure 4: Average Project Grant application team size by NPA career stage
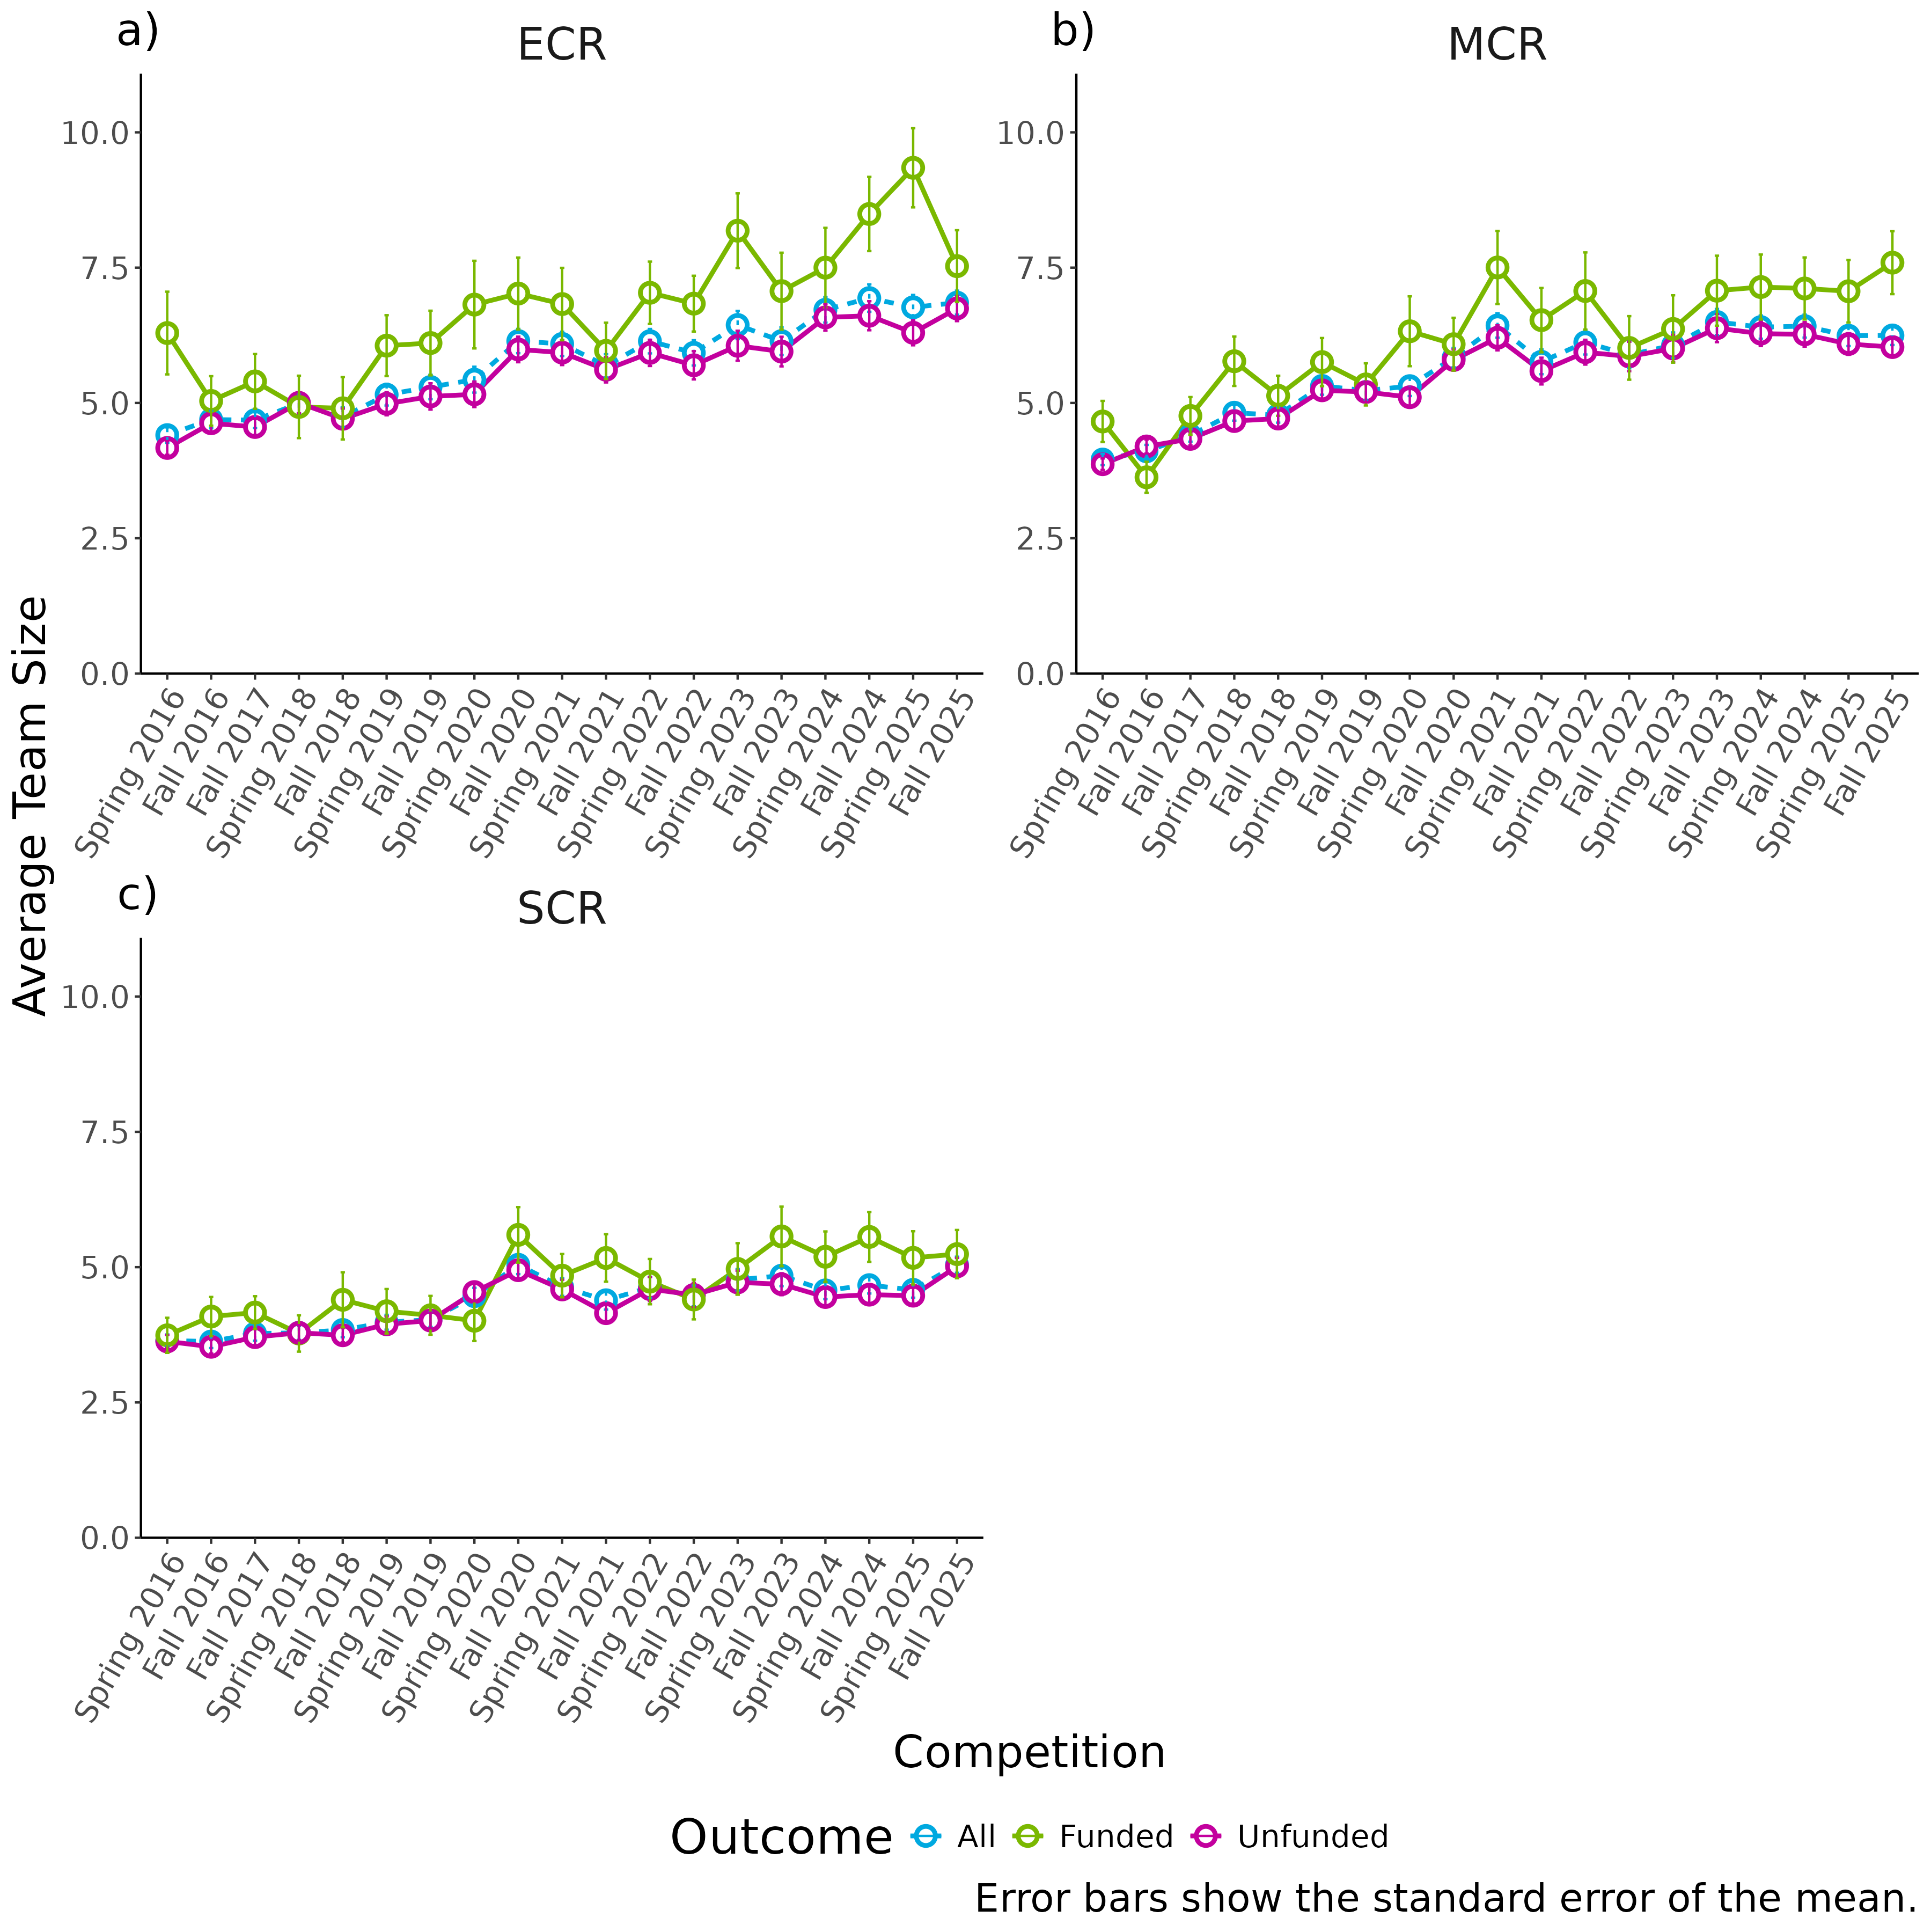
Figure 4 – Long Description
| NPA Career Stage | Outcome | Spring 2016 | Fall 2016 | Fall 2017 | Spring 2018 | Fall 2018 | Spring 2019 | Fall 2019 | Spring 2020 | Fall 2020 | Spring 2021 | Fall 2021 | Spring 2022 | Fall 2022 | Spring 2023 | Fall 2023 | Spring 2024 | Fall 2024 | Spring 2025 | Fall 2025 | All Competitions |
|---|---|---|---|---|---|---|---|---|---|---|---|---|---|---|---|---|---|---|---|---|---|
| ECR | All | 4.41±0.14 (860) |
4.69±0.16 (655) |
4.68±0.15 (821) |
4.99±0.18 (584) |
4.74±0.18 (546) |
5.15±0.2 (541) |
5.29±0.23 (475) |
5.43±0.24 (502) |
6.14±0.22 (619) |
6.09±0.22 (614) |
5.69±0.21 (525) |
6.14±0.23 (580) |
5.93±0.23 (511) |
6.44±0.26 (577) |
6.14±0.26 (524) |
6.72±0.24 (616) |
6.94±0.25 (670) |
6.77±0.23 (751) |
6.85±0.22 (785) |
5.75±0.05 (11,756) |
| ECR | Funded | 6.29±0.76 (96) |
5.04±0.46 (108) |
5.4±0.51 (123) |
4.93±0.58 (82) |
4.9±0.58 (81) |
6.06±0.56 (85) |
6.11±0.6 (84) |
6.82±0.81 (82) |
7.02±0.67 (93) |
6.83±0.67 (110) |
5.96±0.52 (108) |
7.04±0.58 (113) |
6.83±0.52 (103) |
8.18±0.69 (104) |
7.07±0.71 (91) |
7.5±0.74 (94) |
8.49±0.69 (116) |
9.34±0.73 (116) |
7.53±0.66 (108) |
6.76±0.15 (1,897) |
| ECR | Unfunded | 4.17±0.13 (764) |
4.63±0.17 (547) |
4.56±0.15 (698) |
5±0.19 (502) |
4.71±0.19 (465) |
4.98±0.21 (456) |
5.12±0.24 (391) |
5.16±0.24 (420) |
5.99±0.24 (526) |
5.93±0.23 (504) |
5.61±0.23 (417) |
5.93±0.24 (467) |
5.7±0.26 (408) |
6.06±0.28 (473) |
5.95±0.27 (433) |
6.58±0.24 (522) |
6.61±0.27 (554) |
6.3±0.23 (635) |
6.75±0.23 (677) |
5.55±0.05 (9,859) |
| MCR | All | 3.95±0.1 (1,662) |
4.11±0.12 (1,233) |
4.4±0.12 (1,411) |
4.82±0.15 (1,130) |
4.78±0.14 (1,054) |
5.31±0.16 (1,027) |
5.23±0.17 (931) |
5.31±0.18 (917) |
5.84±0.18 (958) |
6.43±0.23 (896) |
5.76±0.23 (726) |
6.12±0.22 (729) |
5.89±0.25 (657) |
6.07±0.24 (760) |
6.5±0.24 (816) |
6.4±0.21 (907) |
6.42±0.21 (968) |
6.24±0.19 (997) |
6.25±0.18 (1,069) |
5.42±0.04 (18,848) |
| MCR | Funded | 4.66±0.38 (181) |
3.63±0.29 (193) |
4.76±0.35 (213) |
5.77±0.46 (157) |
5.13±0.37 (158) |
5.75±0.45 (159) |
5.34±0.39 (172) |
6.32±0.65 (154) |
6.09±0.49 (140) |
7.5±0.68 (157) |
6.53±0.59 (132) |
7.07±0.71 (117) |
6.02±0.59 (119) |
6.37±0.62 (128) |
7.07±0.65 (135) |
7.14±0.6 (127) |
7.11±0.57 (174) |
7.06±0.58 (156) |
7.59±0.58 (147) |
6.05±0.12 (2,919) |
| MCR | Unfunded | 3.87±0.11 (1,481) |
4.2±0.13 (1,040) |
4.34±0.12 (1,198) |
4.67±0.15 (973) |
4.71±0.15 (896) |
5.23±0.17 (868) |
5.2±0.19 (759) |
5.11±0.18 (763) |
5.79±0.19 (818) |
6.2±0.23 (739) |
5.59±0.25 (594) |
5.94±0.23 (612) |
5.86±0.27 (538) |
6.01±0.25 (632) |
6.38±0.26 (681) |
6.28±0.23 (780) |
6.27±0.23 (794) |
6.09±0.2 (841) |
6.03±0.18 (922) |
5.31±0.04 (15,929) |
| SCR | All | 3.64±0.11 (1,287) |
3.63±0.12 (986) |
3.77±0.13 (1,174) |
3.79±0.13 (910) |
3.84±0.14 (878) |
3.98±0.14 (875) |
4.03±0.13 (769) |
4.46±0.15 (709) |
5.04±0.17 (777) |
4.63±0.16 (865) |
4.39±0.17 (758) |
4.63±0.2 (777) |
4.47±0.19 (724) |
4.77±0.2 (776) |
4.84±0.19 (830) |
4.57±0.16 (916) |
4.67±0.15 (989) |
4.58±0.14 (1,061) |
5.04±0.15 (1,240) |
4.33±0.04 (17,301) |
| SCR | Funded | 3.74±0.32 (185) |
4.09±0.36 (171) |
4.16±0.3 (174) |
3.77±0.34 (124) |
4.4±0.51 (131) |
4.19±0.41 (135) |
4.11±0.36 (127) |
4.01±0.38 (101) |
5.6±0.51 (119) |
4.84±0.4 (153) |
5.17±0.44 (177) |
4.73±0.42 (172) |
4.4±0.37 (159) |
4.97±0.48 (151) |
5.57±0.55 (148) |
5.19±0.47 (151) |
5.56±0.46 (163) |
5.17±0.49 (163) |
5.24±0.45 (166) |
4.69±0.1 (2,870) |
| SCR | Unfunded | 3.63±0.12 (1,102) |
3.53±0.13 (815) |
3.71±0.15 (1,000) |
3.79±0.14 (786) |
3.74±0.13 (747) |
3.94±0.14 (740) |
4.01±0.14 (642) |
4.54±0.17 (608) |
4.94±0.18 (658) |
4.59±0.18 (712) |
4.15±0.18 (581) |
4.6±0.22 (605) |
4.49±0.22 (565) |
4.72±0.22 (625) |
4.68±0.2 (682) |
4.45±0.17 (765) |
4.49±0.16 (826) |
4.47±0.15 (898) |
5.01±0.16 (1,074) |
4.26±0.04 (14,431) |
| Overall | Overall | 3.95±0.07 (3,809) |
4.08±0.08 (2,874) |
4.25±0.08 (3,406) |
4.5±0.09 (2,624) |
4.44±0.09 (2,478) |
4.8±0.1 (2,443) |
4.82±0.1 (2,175) |
5.06±0.11 (2,128) |
5.66±0.11 (2,354) |
5.69±0.12 (2,375) |
5.22±0.12 (2,009) |
5.57±0.13 (2,086) |
5.35±0.13 (1,892) |
5.69±0.13 (2,113) |
5.78±0.13 (2,170) |
5.79±0.12 (2,439) |
5.89±0.12 (2,627) |
5.75±0.11 (2,809) |
5.92±0.1 (3,094) |
5.11±0.02 (47,905) |
|
Data is shown as mean ± standard error of the mean. |
|||||||||||||||||||||
Closing thoughts
The team size on CIHR Project applications increased slightly in the last 10 years and mirrored the trends previously reported for research team size based on authorship on scientific publicationsFootnote 3. The slightly larger size of funded teams compared to unfunded teams was in line with the reports of larger research productivity (as measured by citations) of teams versus individualsFootnote 1Footnote 5. These trends could be the result of increasing focus over time on collaboration of many researchers in networks or on multidisciplinary health research.
The trends of increasing team size and larger teams for funded applications were consistent irrespective of the NPA’s gender or career stage. Notably, the differential success by team size was associated with pillar and was not demonstrated for the Biomedical pillar. Further, Biomedical researchers applied to Project with smaller teams compared to the other research pillars, women applied to Project with larger teams compared to men, and senior researchers applied to Project with smaller teams compared to researchers earlier in their careers. When interpreting these variations in team size, it is important to consider that the proportion of applications by NPA gender identity and career stage are not uniform across the research pillars (Table 5).
Table 5: Distribution of Project applications by NPA gender, career stage, and research pillar
| Research Pillar | ECR | MCR | SCR | Total | |||
|---|---|---|---|---|---|---|---|
| Man | Woman | Man | Woman | Man | Woman | ||
| Biomedical | 2,470 (13%) | 1,538 (8%) | 4,994 (26%) | 1,861 (10%) | 6,346 (33%) | 2,054 (11%) | 19,263 |
| Clinical | 977 (14%) | 1,136 (16%) | 1,668 (23%) | 1,388 (19%) | 1,273 (18%) | 698 (10%) | 7,140 |
| HSS | 431 (13%) | 827 (25%) | 508 (15%) | 787 (24%) | 372 (11%) | 413 (12%) | 3,338 |
| SCEP | 331 (10%) | 719 (21%) | 484 (14%) | 868 (26%) | 453 (14%) | 492 (15%) | 3,347 |
|
Applications with research pillar or career stage unspecified or unknown were excluded, as were applications where NPA gender responses were 'gender diverse' or 'I prefer not to answer', as outlined above. |
|||||||
While this analysis was not intended to draw causal conclusions, it highlighted some of the trends in the application team size for CIHR Project grant applications over the years, thereby answering some questions and generating others. For example, it did not draw links between the team size at the time of application, the number of researchers reported as supported by the grant (from yearly reports) or the number of authors on publications supported by the grant. Further analyses into the contributing factors for larger average team size of funded grants, as compared to unfunded, could be explored.
The increasing prevalence of “team science” comes with opportunities and challenges. Some have criticized phenomena such as “hyper-authorship” on ethical grounds (dilution of responsibility, questionable authorship practices)Footnote 3Footnote 6, however, there seems to be growing recognition that research teams are a fixture of modern science and practical resources for conducting team science effectively have emergedFootnote 7Footnote 8. Further, small teams may be more likely to “disrupt” scientific fields through novel ideas and large teams may be more likely to “develop” scientific fields by building upon established ideasFootnote 9.
While a wide range of team sizes was observed for Project grant applications, outside Project, CIHR has provided dedicated research funding for teams through Team Grant programs, running more than a hundred Team Grant competitions, over the years. A recent example is the Transforming Health with Integrated Care (THINC) Implementation Science Team Grants program, which is funding 13 large scale, collaborative projects across Canadian provinces and territories. CIHR’s institutes have also recognized the importance of team science. For example, one strategic priority for CIHR’s Institute of Infection and Immunity for 2021 to 2026 was to “Build relationships and platforms for collaboration to enable team science, and inter- and transdisciplinary approaches.”
Given that some of the greatest accomplishments of modern science, from the completion of the Human Genome Project to the launch of the James Webb Space Telescope would be unthinkable without the concerted efforts of large teams of scientists, team science is here to stay for the foreseeable future and we benefit significantly from embracing it.
Please contact the Funding Analytics team at CIHR (funding-analytics@cihr-irsc.gc.ca) if you have questions about this blog post or would like to share your feedback.
- Date modified: