Gender Equity Data Analysis – Amount of CIHR Funding by Gender (Open Operating Grant Program [OOGP])
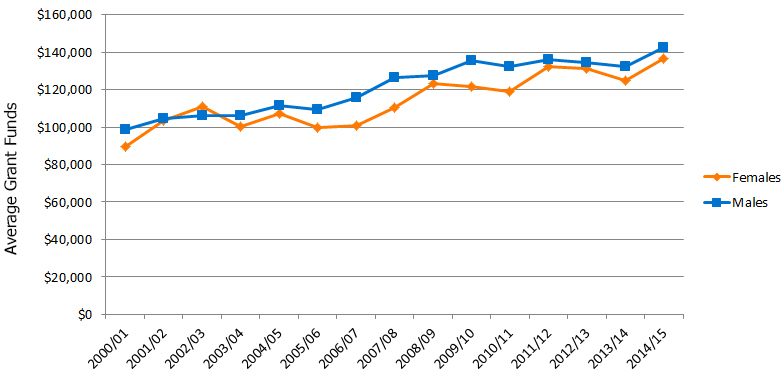
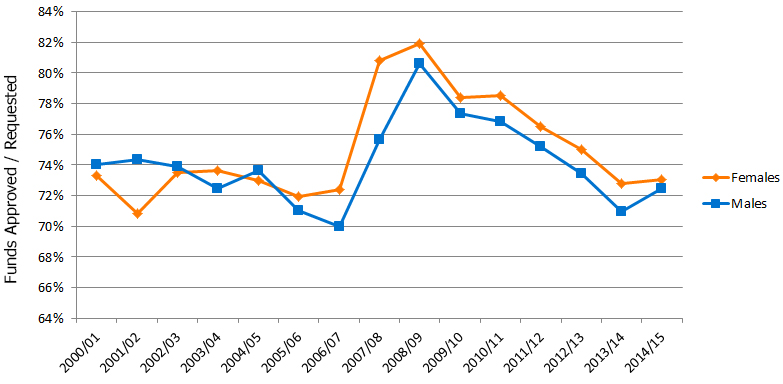
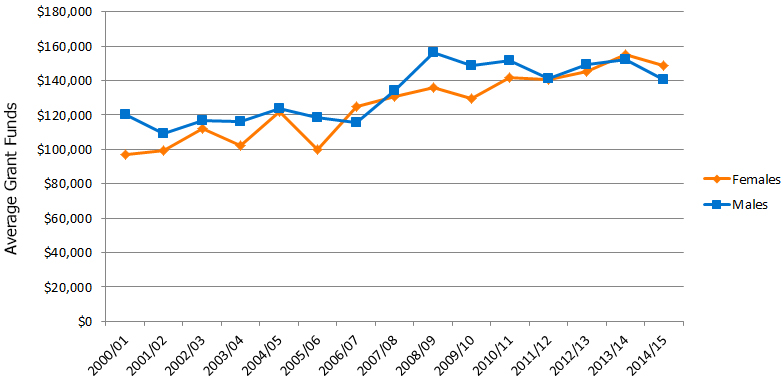
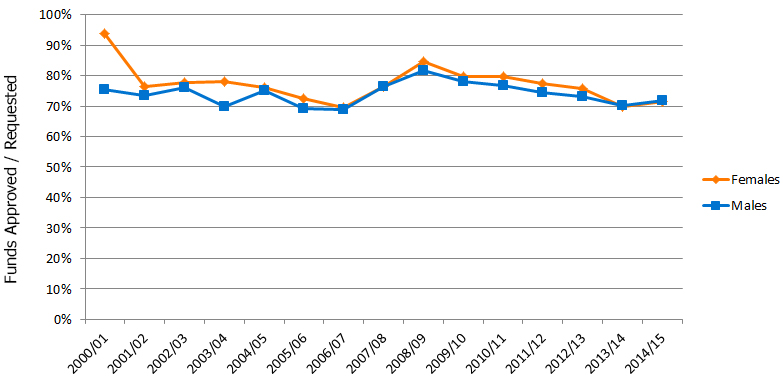
Methods: The data in this section represents the competition results of CIHR's Open Operating Grant Program (OOGP) from 2000/01 to 2014/15. Within each OOGP section, there is a graph (A.) that represents the average amount of funding received per year by gender ("Amount of CIHR Funding"), and a graph (B.) that represents the percent of requested amount that was received, or the amount approved over amount requested ("Percent of Requested CIHR Funding").
- CIHR's Open Operating Grant Program (OOGP) competitions between 2000/01 and 2014/15
- Amount of CIHR Funding by Pillar
- Amount of CIHR Funding by Career Stage
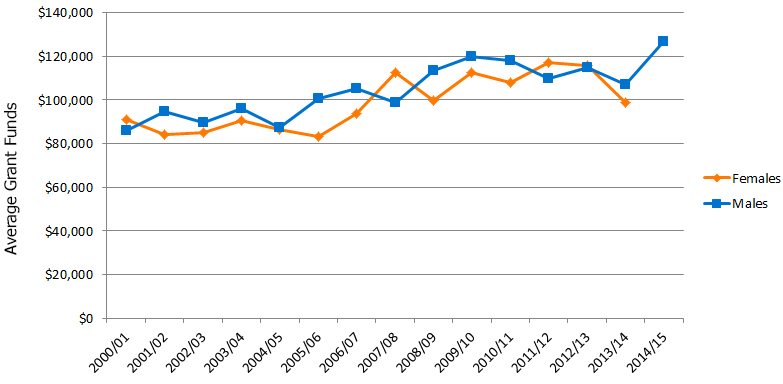
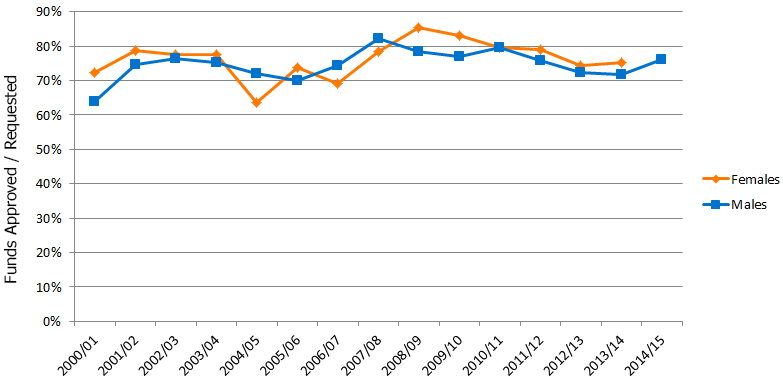
CIHR's Open Operating Grant Program (OOGP) competitions between 2000/01 and 2014/15
A.
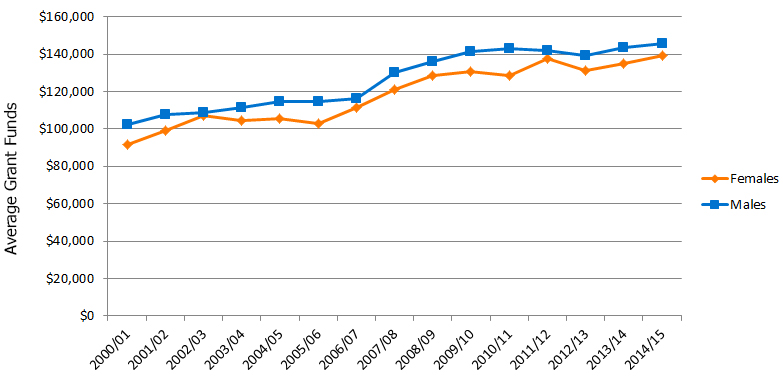
Long description
| Females | Males | |
|---|---|---|
| 2000/01 | 91,471.01 | 102,432.40 |
| 2001/02 | 99,138.38 | 107,686.43 |
| 2002/03 | 107,209.59 | 108,933.22 |
| 2003/04 | 104,682.71 | 111,238.07 |
| 2004/05 | 105,717.52 | 114,354.37 |
| 2005/06 | 102,799.41 | 114,788.10 |
| 2006/07 | 111,254.02 | 115,952.11 |
| 2007/08 | 120,814.32 | 130,139.31 |
| 2008/09 | 128,281.21 | 136,123.77 |
| 2009/10 | 130,465.73 | 141,408.73 |
| 2010/11 | 128,609.60 | 142,791.20 |
| 2011/12 | 137,419.13 | 141,813.23 |
| 2012/13 | 131,317.56 | 139,354.61 |
| 2013/14 | 134,682.44 | 143,279.40 |
| 2014/15 | 139,301.09 | 145,512.92 |
B.
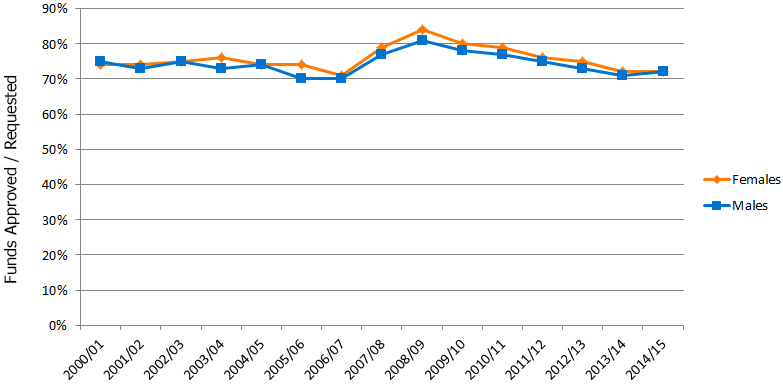
Long description
| Females | Males | |
|---|---|---|
| 2000/01 | 74 | 75 |
| 2001/02 | 74 | 73 |
| 2002/03 | 75 | 75 |
| 2003/04 | 76 | 73 |
| 2004/05 | 74 | 74 |
| 2005/06 | 74 | 70 |
| 2006/07 | 71 | 70 |
| 2007/08 | 79 | 77 |
| 2008/09 | 84 | 81 |
| 2009/10 | 80 | 78 |
| 2010/11 | 79 | 77 |
| 2011/12 | 76 | 75 |
| 2012/13 | 75 | 73 |
| 2013/14 | 72 | 71 |
| 2014/15 | 72 | 72 |
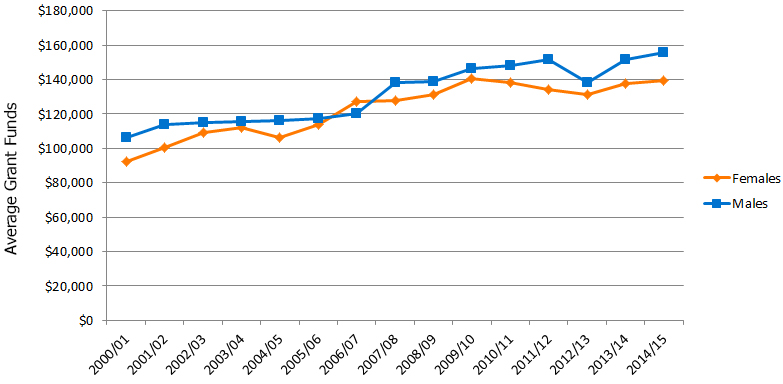
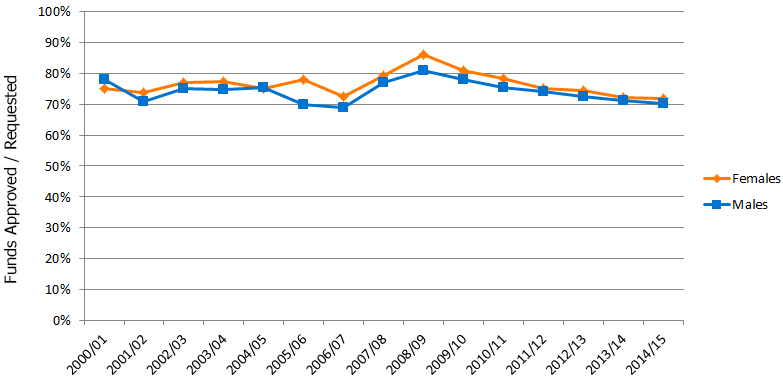
Amount of CIHR Funding by Pillar
Biomedical Research
A.
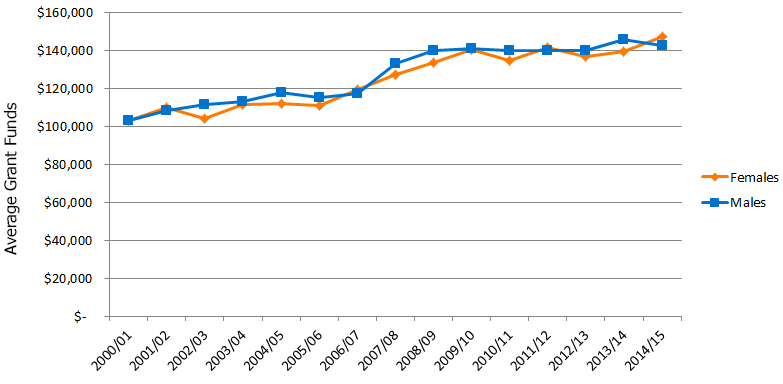
Long description
| Females | Males | |
|---|---|---|
| 2000/01 | 103,056 | 103,364 |
| 2001/02 | 110,209 | 108,405 |
| 2002/03 | 104,399 | 111,854 |
| 2003/04 | 111,379 | 113,390 |
| 2004/05 | 112,041 | 117,799 |
| 2005/06 | 111,288 | 115,275 |
| 2006/07 | 119,606 | 117,465 |
| 2007/08 | 127,568 | 133,106 |
| 2008/09 | 133,848 | 139,833 |
| 2009/10 | 140,446 | 140,842 |
| 2010/11 | 134,717 | 139,910 |
| 2011/12 | 141,531 | 139,835 |
| 2012/13 | 136,660 | 140,140 |
| 2013/14 | 139,729 | 145,819 |
| 2014/15 | 147,536 | 142,662 |
B.
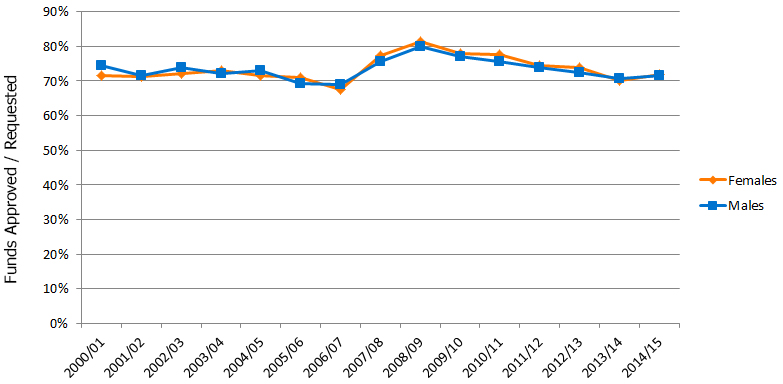
Long description
| Females | Males | |
|---|---|---|
| 2000/01 | 72 | 74 |
| 2001/02 | 71 | 71 |
| 2002/03 | 72 | 74 |
| 2003/04 | 73 | 72 |
| 2004/05 | 71 | 73 |
| 2005/06 | 71 | 69 |
| 2006/07 | 67 | 69 |
| 2007/08 | 77 | 76 |
| 2008/09 | 81 | 80 |
| 2009/10 | 78 | 77 |
| 2010/11 | 77 | 75 |
| 2011/12 | 74 | 74 |
| 2012/13 | 74 | 72 |
| 2013/14 | 70 | 71 |
| 2014/15 | 72 | 71 |
Clinical Research
A.
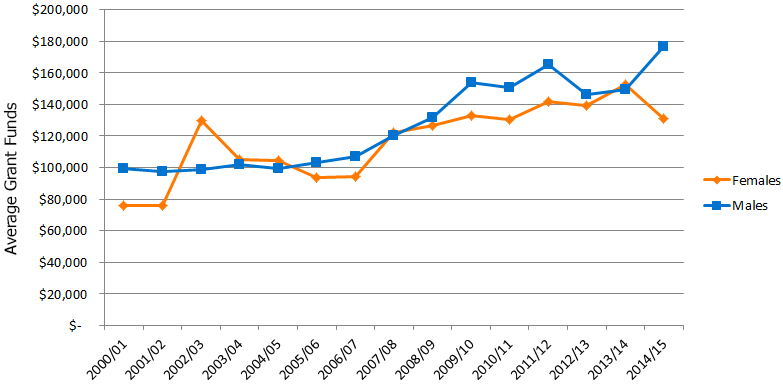
Long description
| Females | Males | |
|---|---|---|
| 2000/01 | 75,911 | 99,334 |
| 2001/02 | 76,197 | 97,508 |
| 2002/03 | 129,931 | 98,623 |
| 2003/04 | 104,767 | 101,704 |
| 2004/05 | 104,525 | 99,128 |
| 2005/06 | 93,921 | 103,260 |
| 2006/07 | 93,977 | 107,161 |
| 2007/08 | 121,875 | 120,510 |
| 2008/09 | 126,445 | 131,608 |
| 2009/10 | 132,626 | 154,081 |
| 2010/11 | 130,499 | 150,593 |
| 2011/12 | 141,953 | 165,346 |
| 2012/13 | 139,174 | 146,384 |
| 2013/14 | 152,829 | 149,137 |
| 2014/15 | 131,246 | 176,445 |
B.
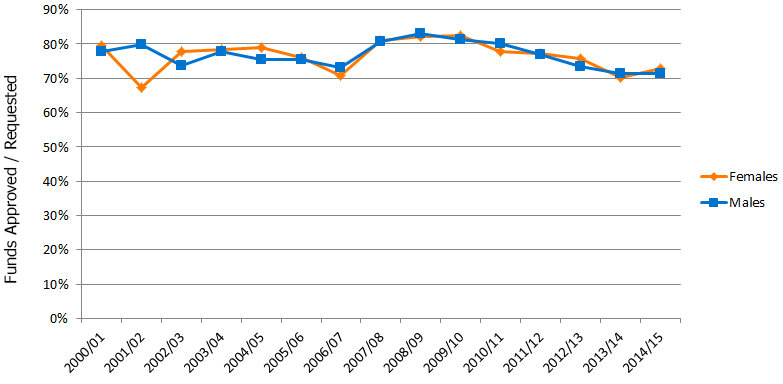
Long description
| Females | Males | |
|---|---|---|
| 2000/01 | 79 | 78 |
| 2001/02 | 67 | 80 |
| 2002/03 | 78 | 74 |
| 2003/04 | 78 | 78 |
| 2004/05 | 79 | 75 |
| 2005/06 | 76 | 75 |
| 2006/07 | 71 | 73 |
| 2007/08 | 81 | 81 |
| 2008/09 | 82 | 83 |
| 2009/10 | 82 | 81 |
| 2010/11 | 78 | 80 |
| 2011/12 | 77 | 77 |
| 2012/13 | 76 | 74 |
| 2013/14 | 70 | 71 |
| 2014/15 | 73 | 71 |
Health Systems and Services Research
A.
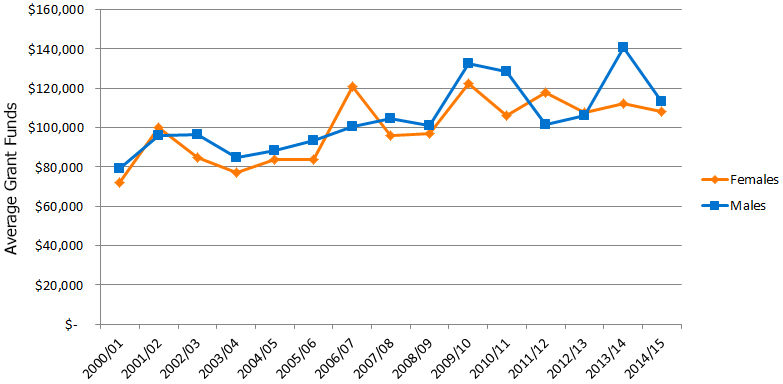
Long description
| Females | Males | |
|---|---|---|
| 2000/01 | 71,851 | 79,032 |
| 2001/02 | 100,233 | 95,782 |
| 2002/03 | 84,683 | 96,734 |
| 2003/04 | 77,271 | 85,006 |
| 2004/05 | 83,812 | 88,190 |
| 2005/06 | 83,895 | 93,323 |
| 2006/07 | 120,794 | 100,629 |
| 2007/08 | 96,064 | 104,855 |
| 2008/09 | 97,211 | 101,011 |
| 2009/10 | 122,507 | 132,713 |
| 2010/11 | 106,337 | 128,579 |
| 2011/12 | 117,848 | 101,426 |
| 2012/13 | 107,463 | 106,330 |
| 2013/14 | 112,421 | 140,771 |
| 2014/15 | 108,034 | 113,253 |
B.
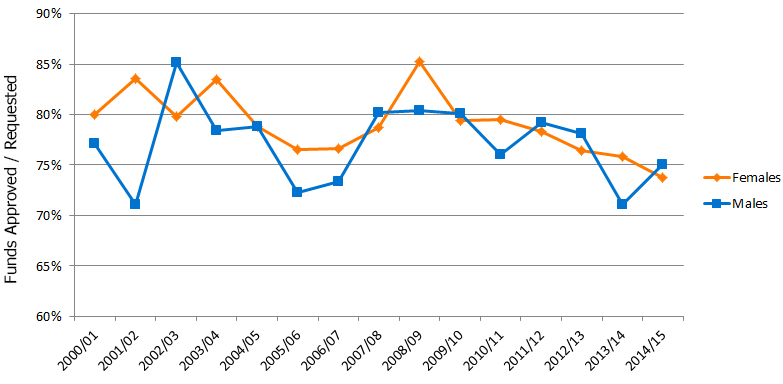
Long description
| Females | Males | |
|---|---|---|
| 2000/01 | 80 | 77 |
| 2001/02 | 84 | 71 |
| 2002/03 | 80 | 85 |
| 2003/04 | 83 | 78 |
| 2004/05 | 79 | 79 |
| 2005/06 | 77 | 72 |
| 2006/07 | 77 | 73 |
| 2007/08 | 79 | 80 |
| 2008/09 | 85 | 80 |
| 2009/10 | 79 | 80 |
| 2010/11 | 79 | 76 |
| 2011/12 | 78 | 79 |
| 2012/13 | 76 | 78 |
| 2013/14 | 76 | 71 |
| 2014/15 | 74 | 75 |
Social, Cultural, Environmental, and Population Health Research
A.
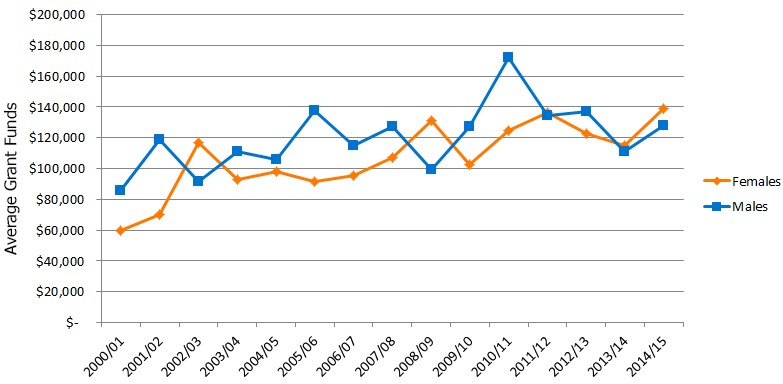
Long description
| Females | Males | |
|---|---|---|
| 2000/01 | 59,495 | 85,698 |
| 2001/02 | 70,118 | 118,699 |
| 2002/03 | 117,108 | 91,234 |
| 2003/04 | 93,020 | 110,813 |
| 2004/05 | 98,143 | 105,951 |
| 2005/06 | 91,234 | 137,709 |
| 2006/07 | 95,335 | 115,142 |
| 2007/08 | 106,934 | 127,420 |
| 2008/09 | 131,095 | 99,217 |
| 2009/10 | 102,373 | 127,103 |
| 2010/11 | 124,737 | 172,135 |
| 2011/12 | 136,468 | 134,336 |
| 2012/13 | 122,717 | 137,149 |
| 2013/14 | 114,963 | 110,860 |
| 2014/15 | 139,100 | 127,773 |
B.
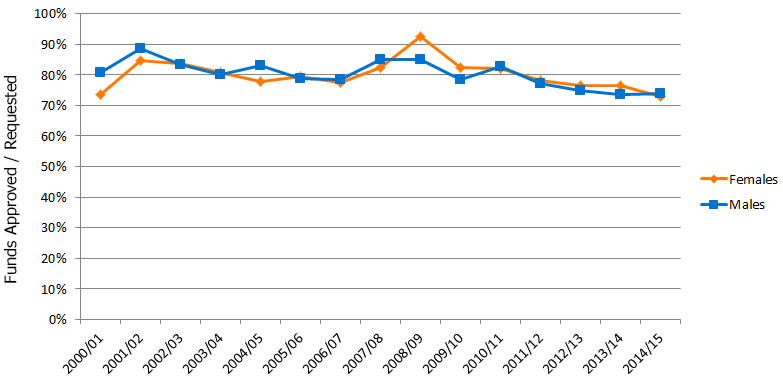
Long description
| Females | Males | |
|---|---|---|
| 2000/01 | 74 | 81 |
| 2001/02 | 85 | 88 |
| 2002/03 | 84 | 83 |
| 2003/04 | 81 | 80 |
| 2004/05 | 78 | 83 |
| 2005/06 | 79 | 79 |
| 2006/07 | 77 | 79 |
| 2007/08 | 82 | 85 |
| 2008/09 | 92 | 85 |
| 2009/10 | 82 | 78 |
| 2010/11 | 82 | 83 |
| 2011/12 | 78 | 77 |
| 2012/13 | 77 | 75 |
| 2013/14 | 77 | 74 |
| 2014/15 | 73 | 74 |
Amount of CIHR Funding by Career Stage
NB: Except for certain competitions, CIHR does not collect information on an applicant's career stage. In the data below, the applicant's age was used as an approximate facsimile to career stage.
NB: Sample sizes for investigators over 65 are very small. Values representing less than 8 grants are not shown.
Early Career Investigators (<36 years)
A.
Long description
| Females | Males | |
|---|---|---|
| 2000/01 | 91,166.79 | 86,145.09 |
| 2001/02 | 84,363.29 | 94,724.77 |
| 2002/03 | 85,041.38 | 89,692.46 |
| 2003/04 | 90,495.88 | 96,030.76 |
| 2004/05 | 86,655.87 | 87,541.61 |
| 2005/06 | 83,329.61 | 100,619.19 |
| 2006/07 | 93,863.71 | 105,237.38 |
| 2007/08 | 112,584.14 | 98,721.92 |
| 2008/09 | 99,663.18 | 113,529.12 |
| 2009/10 | 112,764.83 | 119,853.75 |
| 2010/11 | 108,106.75 | 118,103.86 |
| 2011/12 | 117,084.01 | 109,864.93 |
| 2012/13 | 115,648.15 | 114,925.80 |
| 2013/14 | 98,640.42 | 107,153.94 |
| 2014/15 | 126,788.29 |
B.
Long description
| Females | Males | |
|---|---|---|
| 2000/01 | 72 | 64 |
| 2001/02 | 79 | 75 |
| 2002/03 | 77 | 76 |
| 2003/04 | 78 | 75 |
| 2004/05 | 64 | 72 |
| 2005/06 | 74 | 70 |
| 2006/07 | 69 | 74 |
| 2007/08 | 78 | 82 |
| 2008/09 | 85 | 79 |
| 2009/10 | 83 | 77 |
| 2010/11 | 80 | 80 |
| 2011/12 | 79 | 76 |
| 2012/13 | 74 | 72 |
| 2013/14 | 75 | 72 |
| 2014/15 | 76 |
Mid-Career Investigators (36-45 years)
A.
Long description
| Females | Males | |
|---|---|---|
| 2000/01 | 89,663.71 | 98,914.75 |
| 2001/02 | 103,685.41 | 104,674.41 |
| 2002/03 | 110,766.80 | 106,289.00 |
| 2003/04 | 100,148.26 | 106,132.05 |
| 2004/05 | 107,190.30 | 111,707.09 |
| 2005/06 | 99,710.77 | 109,546.25 |
| 2006/07 | 100,714.17 | 115,630.24 |
| 2007/08 | 110,179.49 | 126,429.93 |
| 2008/09 | 123,023.98 | 127,346.61 |
| 2009/10 | 121,382.36 | 135,412.26 |
| 2010/11 | 118,932.05 | 132,039.91 |
| 2011/12 | 132,217.41 | 136,121.92 |
| 2012/13 | 131,189.43 | 134,493.36 |
| 2013/14 | 124,763.39 | 132,267.78 |
| 2014/15 | 136,489.56 | 142,608.91 |
B.
Long description
| Females | Males | |
|---|---|---|
| 2000/01 | 73 | 74 |
| 2001/02 | 71 | 74 |
| 2002/03 | 73 | 74 |
| 2003/04 | 74 | 72 |
| 2004/05 | 73 | 74 |
| 2005/06 | 72 | 71 |
| 2006/07 | 72 | 70 |
| 2007/08 | 81 | 76 |
| 2008/09 | 82 | 81 |
| 2009/10 | 78 | 77 |
| 2010/11 | 78 | 77 |
| 2011/12 | 76 | 75 |
| 2012/13 | 75 | 73 |
| 2013/14 | 73 | 71 |
| 2014/15 | 73 | 72 |
Mid-Career Investigators (46-55 years)
A.
Long description
| Females | Males | |
|---|---|---|
| 2000/01 | 92,548.35 | 106,114.40 |
| 2001/02 | 100,605.11 | 113,929.62 |
| 2002/03 | 108,958.10 | 114,746.26 |
| 2003/04 | 112,291.24 | 115,690.88 |
| 2004/05 | 106,227.66 | 115,919.23 |
| 2005/06 | 113,746.23 | 117,406.78 |
| 2006/07 | 126,936.69 | 120,065.83 |
| 2007/08 | 127,911.14 | 138,153.53 |
| 2008/09 | 131,242.13 | 139,040.47 |
| 2009/10 | 140,702.50 | 146,569.58 |
| 2010/11 | 138,512.84 | 148,314.92 |
| 2011/12 | 134,142.44 | 151,758.94 |
| 2012/13 | 130,973.80 | 138,458.85 |
| 2013/14 | 137,406.61 | 151,574.87 |
| 2014/15 | 139,512.72 | 155,412.72 |
B.
Long description
| Females | Males | |
|---|---|---|
| 2000/01 | 75 | 78 |
| 2001/02 | 74 | 71 |
| 2002/03 | 77 | 75 |
| 2003/04 | 77 | 75 |
| 2004/05 | 75 | 75 |
| 2005/06 | 78 | 70 |
| 2006/07 | 72 | 69 |
| 2007/08 | 79 | 77 |
| 2008/09 | 86 | 81 |
| 2009/10 | 81 | 78 |
| 2010/11 | 78 | 75 |
| 2011/12 | 75 | 74 |
| 2012/13 | 75 | 72 |
| 2013/14 | 72 | 71 |
| 2014/15 | 72 | 70 |
Senior Investigators (56-65 years)
A.
Long description
| Females | Males | |
|---|---|---|
| 2000/01 | 96,815.16 | 120,029.55 |
| 2001/02 | 99,436.09 | 109,021.92 |
| 2002/03 | 112,092.30 | 116,729.70 |
| 2003/04 | 102,219.57 | 116,373.46 |
| 2004/05 | 121,806.65 | 123,586.57 |
| 2005/06 | 99,943.13 | 118,493.48 |
| 2006/07 | 124,728.54 | 115,519.57 |
| 2007/08 | 130,768.01 | 133,898.51 |
| 2008/09 | 136,122.35 | 156,102.90 |
| 2009/10 | 129,371.17 | 148,422.60 |
| 2010/11 | 141,730.66 | 151,358.20 |
| 2011/12 | 140,398.65 | 141,159.85 |
| 2012/13 | 145,382.79 | 149,236.49 |
| 2013/14 | 155,022.38 | 152,417.02 |
| 2014/15 | 148,718.95 | 140,583.13 |
B.
Long description
| Females | Males | |
|---|---|---|
| 2000/01 | 94 | 76 |
| 2001/02 | 76 | 73 |
| 2002/03 | 78 | 76 |
| 2003/04 | 78 | 70 |
| 2004/05 | 76 | 75 |
| 2005/06 | 72 | 69 |
| 2006/07 | 70 | 69 |
| 2007/08 | 77 | 76 |
| 2008/09 | 85 | 82 |
| 2009/10 | 80 | 78 |
| 2010/11 | 80 | 77 |
| 2011/12 | 78 | 74 |
| 2012/13 | 76 | 73 |
| 2013/14 | 70 | 70 |
| 2014/15 | 72 | 72 |
Senior Investigators (>65 years)
A.
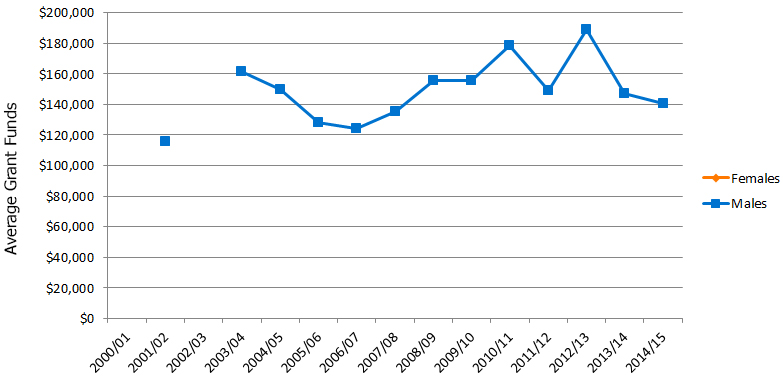
Long description
| Females | Males | |
|---|---|---|
| 2000/01 | ||
| 2001/02 | 115,695.47 | |
| 2002/03 | ||
| 2003/04 | 161,313.31 | |
| 2004/05 | 149,883.29 | |
| 2005/06 | 128,136.26 | |
| 2006/07 | 124,120.94 | |
| 2007/08 | 135,087.83 | |
| 2008/09 | 155,499.71 | |
| 2009/10 | 155,599.51 | |
| 2010/11 | 178,562.22 | |
| 2011/12 | 149,187.03 | |
| 2012/13 | 188,984.74 | |
| 2013/14 | 146,814.23 | |
| 2014/15 | 140,314.41 |
B.
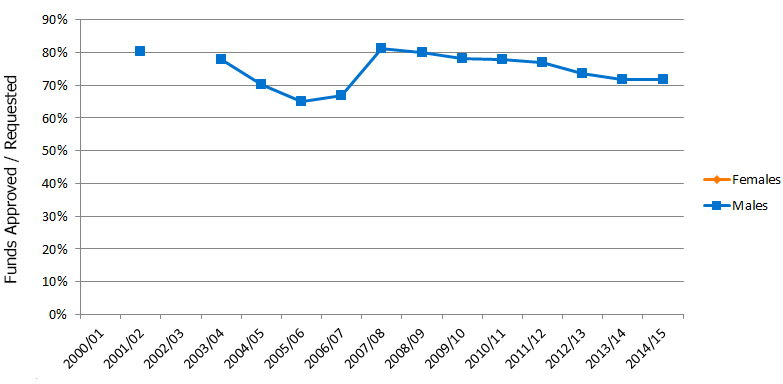
Long description
| Females | Males | |
|---|---|---|
| 2000/01 | ||
| 2001/02 | 80 | |
| 2002/03 | ||
| 2003/04 | 78 | |
| 2004/05 | 70 | |
| 2005/06 | 65 | |
| 2006/07 | 67 | |
| 2007/08 | 81 | |
| 2008/09 | 80 | |
| 2009/10 | 78 | |
| 2010/11 | 78 | |
| 2011/12 | 77 | |
| 2012/13 | 74 | |
| 2013/14 | 72 | |
| 2014/15 | 72 |
Note: The n-value is very low for Senior Investigators (>65); therefore, the data should be interpreted with that in mind. Also, values representing less than 8 grants are not shown, which is why there are no female values in the above figure.
- Date modified: