Technical Report on Feedback on Peer Review Quality Surveys
Prairie Research Associates (PRA)
November 25, 2016
Table of Contents
- 1.0 Overview
- 2.0 Profile of respondents
- 3.0 Applicants (n = 1,077)
- 4.0 Stage 1 reviewer (n = 724)
- 5.0 Virtual chair (n = 69)
- 6.0 Final assessment stage reviewers (n = 14)
- 7.0 Key findings
- Appendix A – Applicant Survey Results
- Appendix B – Stage 1 ReviewersSurvey Results
- Appendix C – Virtual Chairs Survey Results
- Appendix D – Final Assessment Stage Reviewers Survey Results
- Appendix E – Addendum to the Tables Presenting Level of Agreement Data (Added to the Report on March 31, 2017 by CIHR)
1.0 Overview
The Canadian Institutes of Health Research (CIHR) hired PRA Inc. to conduct an independent analysis of survey responses collected from CIHR’s spring 2016 Project Grant competition stakeholders (i.e., grant applicants, peer reviewers, and virtual chairs). The survey gauged stakeholders’ feedback about peer review quality during the 2016 Project Grant competition. The survey also gauged participants’ feedback on whether the indicators proposed to measure quality are appropriate. Findings from the analysis of the survey data will help inform future peer review quality assurance practices at CIHR.
1.1 Methodology
CIHR created a unique survey for each of the four stakeholder groups. The surveys were programmed into an online survey platform in English and French (Fluid Surveys) and emailed to stakeholders involved in the spring 2016 Project Grant competition. Applicants with more than one application for the competition were only allowed to complete the survey once.
After the initial email, stakeholders who had not fully completed their survey were sent reminder emails approximately one and two weeks after the initial email. The dates for each of the four stakeholder groups are shown in the table below.
| Applicants | Final assessment stage reviewer | Stage 1 reviewer | Virtual chair | |
|---|---|---|---|---|
| Initial email | August 4, 2016 | July 20, 2016 | July 7, 2016 | July 7, 2016 |
| Close date | August 29, 2016 | August 15, 2016 | August 1, 2016 | August 1, 2016 |
1.2 Identifying survey respondents
CIHR provided PRA with a dataset for each of the four surveys. PRA analyzed the responses to assess the records that would be used for reporting. Based on PRA’s assessment of the records, PRA identified four types of respondents:
- Completed survey – These responses were marked in the dataset as complete, and were from respondents who answered all mandatory questions and clicked the button at the end of the survey to submit their responses.
- Partial complete – Respondents answered all questions, but skipped some open-ended questions that appeared to be non-forced responses.
- False incomplete – Respondents appear to have answered all questions, but did not appear to click the
“Submit”
button at the end of the survey. - Incomplete – Many questions were not answered or missing.
A breakdown of responses by type is shown in the table below. Based on consultation with CIHR, PRA decided to include responses for all groups, with the exception of those identified as incomplete.
| Applicants | Final assessment stage reviewer | Stage 1 reviewer | Virtual chair | |
|---|---|---|---|---|
| Completed survey | 1,044 | 11 | 689 | 64 |
| Partial complete | 26 | 1 | 28 | 3 |
| False incomplete | 7 | 2 | 7 | 2 |
| Total completions | 1,077 | 14 | 724 | 71 |
| Incomplete | 176 | 1 | 210 | 2 |
1.2.1 Completion rates
Based on the final defined completions, the completion rates are shown in the table below. The completion rates range from 36% for applicants up to 61% for virtual chairs.
| Applicants | Final assessment stage reviewer | Stage 1 reviewer | Virtual chair | |
|---|---|---|---|---|
| Sample size | 3,037 | 29 | 1,664 | 116 |
| Total completions | 1,077 | 14 | 724 | 71 |
| Completion rate | 35.5% | 48.3% | 43.5% | 61.2% |
1.3 Reporting frequencies
Throughout this report, any questions where respondents were able to select ‘Not applicable’ have been removed from calculations. Frequencies for all questions can be found in Appendices A to D.
1.4 Assessing statistical significance
Crosstabulations were conducted for the stage 1 reviewer and applicants between several demographic variables outlined below for all single response questions. For crosstabulations with questions with a seven-point scale, the collapsed version (top two ratings, middle three, bottom two) were used in analysis. The following variables were assessed:
- Applicants – sex (male/female), career stage (early, mid, and senior scientist), pillar (biomedical, clinical, health systems/services, and social, cultural, environmental, and population health), and application funded (yes/no)
- Stage 1 reviewer – sex (male/female), career stage (early, mid, and senior scientist; knowledge users and other were dropped given inadequate sample size), and pillar (biomedical, clinical, health systems/services, and social, cultural, environmental, and population health).
Sub-group analyses were not conducted for virtual chair and final assessment stage reviewers given small total sample sizes for each group.
All differences for crosstabulations discussed in this report had a p-value of less than .05.
2.0 Profile of respondents
The table below provides a profile of respondents to each of the four surveys, showing the breakdown of respondents by sex, classification, position, and pillar (along with whether applicants’ applications were funded). The information shown below was provided by respondents, with the exception of respondents’ sex, which was provided by CIHR.
| Applicants (n = 1,077) |
Stage 1 reviewer (n = 724) |
Stage 1 virtual chair (n = 69) |
Final assessment stage reviewer (n = 14) |
|
|---|---|---|---|---|
| Sex | ||||
| Female | 37% | 44% | 32% | 36% |
| Male | 63% | 56% | 68% | 64% |
| Career stage | ||||
| Early-career scientist (≤ 5 years) | 25% | 10% | - | - |
| Mid-career scientist (5 – 15 years) | 42% | 41% | 23% | 29% |
| Senior scientist (> 15 years) | 33% | 43% | 71% | 64% |
| Knowledge user | N/A | 4% | 4% | 7% |
| Other | - | 3% | 1% | - |
| PositionTable 4 note * | ||||
| Professor | 41% | 45% | 67% | 57% |
| Associate professor | 32% | 33% | 23% | 21% |
| Assistant professor | 25% | 15% | 1% | - |
| Researcher | 12% | 18% | 28% | 14% |
| Clinician | 8% | 13% | 13% | 7% |
| Scientist | 7% | 4% | 6% | - |
| Senior scientist | 6% | 7% | 20% | 14% |
| Research administrator | 1% | 4% | 13% | 7% |
| Professor emeritus | 1% | <1% | 3% | 7% |
| Dean of research | <1% | 1% | 6% | - |
| Department head/chair | - | 1% | - | - |
| Other | 1% | 4% | 1% | - |
| Pillar | ||||
| Biomedical | 68% | 47% | 65% | 64% |
| Clinical | 14% | 26% | 15% | 14% |
| Social, cultural, environmental, and population health | 10% | 13% | 17% | 14% |
| Health systems/services | 8% | 11% | 3% | 7% |
| Not applicable | 1% | 2% | - | - |
| Application funded | ||||
| Yes | 23% | N/A | N/A | N/A |
| No | 77% | N/A | N/A | N/A |
Note: Totals may not sum to 100% due to rounding.
3.0 Applicants (n = 1,077)
This section examines responses from applicants.
3.1 Consistency of reviews aligning with ratings
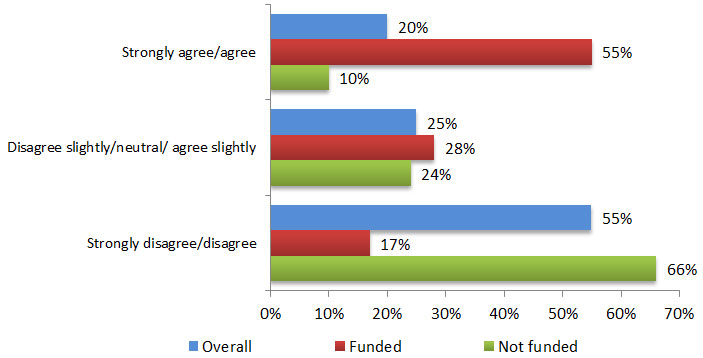
The majority of applicants (55%) disagreed or strongly disagreed that the written reviews they received at stage 1 were consistent with the rating they received (O++, O+, O, E++, E+, E, G, F, P). In contrast, 20% of applicants agreed or strongly agreed that the written reviews from stage 1 aligned with the rating given.
Results also show that scientists with funded applications were much more likely to agree or strongly agree (55%), compared to those not funded (10%).
Figure 1: Agreement that Stage 1 reviews were consistent (n = 1,072)
The reviews that I received at Stage 1 are consistent in that, the written justifications (strengths and weaknesses) align with respective ratings (O++, O+, O, E++, E+, E, G, F, P)
Long description
| Strongly agree/agree | Disagree slightly/neutral/agree slightly | Strongly disagree/disagree | |
|---|---|---|---|
| Overall | 20% | 25% | 55% |
| Funded | 55% | 28% | 17% |
| Not Funded | 10% | 24% | 66% |
Key differences. There were a few statistically significant differences among groups and their responses to the question above:
- Career stage – Early-career scientists were statistically less likely to disagree or strongly disagree (46%) that the reviews aligned with ratings, compared to mid-career scientists (57%) and senior scientists (58%).
- Pillar – Scientists in the biomedical (59%) domain were more likely than those in the social, cultural, environmental, and population health (49%), clinical (43%), and health systems/services (42%) pillars to disagree or strongly disagree.
3.1.1 Optional comments on consistency of ratings
When asked to comment on the consistency of reviews they received, respondents were most concerned about variation between reviewers, followed by inconsistency between written comments and the actual ratings. In particular, almost one in five respondents noted too much variance/deviation between reviewers (18%), followed by comments did not match ratings (12%). Applicants were also concerned that reviewers lacked proper expertise/knowledge in the area (8%).
3.2 Using reviews for future applications
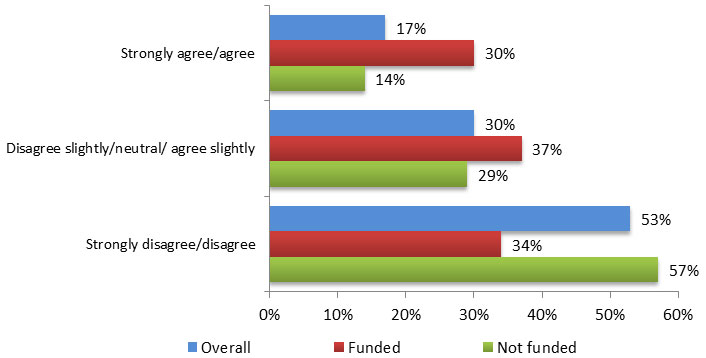
Over half (53%) disagreed or strongly disagreed that the reviews received at stage 1 will provide useful information when applying for future competitions. Less than one in five applicants (17%) strongly agreed or agreed that the reviews would help future competition applications. Scientists with funded applications were about twice as likely to agree or strongly agree (30%) compared to those not funded (14%).
Figure 2: Agreement that Stage 1 reviews will provide information useful in refining application for a future competition (n = 1,006)
The reviews (ratings and strengths/weaknesses) that I received at Stage 1 will provide information that will be useful in refining my application for a future competition
Long description
| Strongly agree/agree | Disagree slightly/neutral/agree slightly | Strongly disagree/disagree | |
|---|---|---|---|
| Overall | 17% | 30% | 53% |
| Funded | 30% | 37% | 34% |
| Not Funded | 14% | 29% | 57% |
Key differences. There were a few statistically significant differences among groups and responses to the question above:
- Career stage – Results show that early-career scientists were about twice as likely to agree or strongly agree (26%) compared to mid-career scientists (13%) and senior scientists (14%).
- Pillar – Also, those in biomedical (58%) domains were much more likely to strongly disagree/disagree than those in in social, cultural, environmental, and population health (47%), clinical pillar (42%) and health systems/services (39%).
3.2.1 Optional comments on using reviews for future applications
When asked to provide comments on the use of reviews to refine future applications, the most common responses were that the comments were irrelevant/lacked proper insight (14%) or that the majority of comments did not provide enough information to improve future applications (10%). Most of the applicant’s comments were negative, with only 6% providing no negative comments or improvements they could make to future applications.
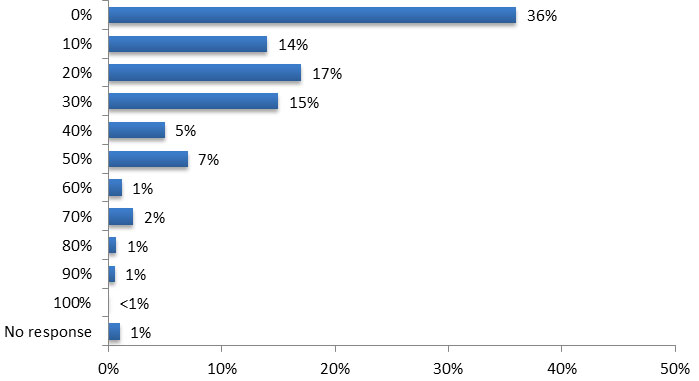
3.3 Proportion of unsatisfactory reviews
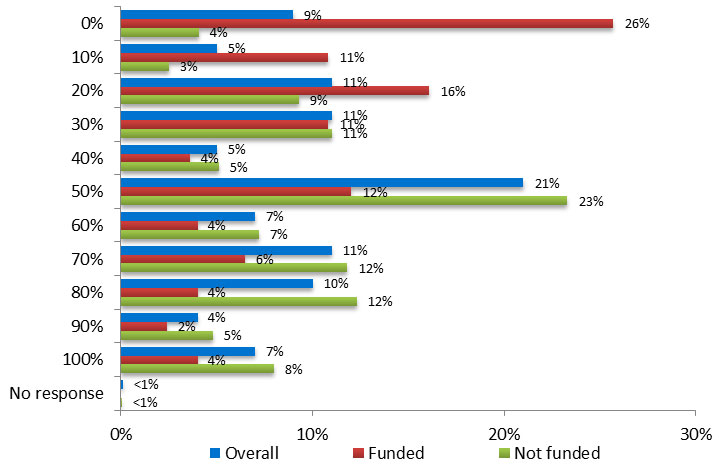
Just 9% of applicants indicated that none of their reviews was of unsatisfactory quality. Conversely, 91% thought at least some of the reviews were unsatisfactory. Among them, 39% indicated that more than half were unsatisfactory, with another 21% believing that half were unsatisfactory.
When examining results by funding, there is a clear difference shown in the fact that 26% of those with funding thought none of the reviews was unsatisfactory, while just 4% of those not funded thought none was unsatisfactory.
Figure 3: Percentage of reviews that were unsatisfactory (n = 1077)
Approximately what percentage of the received reviews did you feel were of unsatisfactory review quality?
Long description
| 0% | 10% | 20% | 30% | 40% | 50% | 60% | 70% | 80% | 90% | 100% | No response | |
|---|---|---|---|---|---|---|---|---|---|---|---|---|
| Overall | 9% | 5% | 11% | 11% | 5% | 21% | 7% | 11% | 10% | 4% | 7% | <1% |
| Funded | 26% | 11% | 16% | 11% | 4% | 12% | 4% | 6% | 4% | 2% | 4% | 0% |
| Not Funded | 4% | 3% | 9% | 11% | 5% | 23% | 7% | 12% | 12% | 5% | 8% | <1% |
Key differences. Results show several differences among groups and their perceptions of the proportion of reviews that were unsatisfactory; however, the differences by career stage and pillar are very small (although statistically different), with differences of typically just three to four percentage points among groups.
3.3.1 Optional comments on unsatisfactory review quality
When asked to comment on reviews they felt were of unsatisfactory quality, only 36% of applicants provided a comment. The most common issues noted were that the reviewers did not provide enough detail in responses to understand weakness/make improvements (10%) or unsatisfactory reviews came from reviewers who were not qualified/knowledgeable in the area of research (9%). Along similar lines, some questioned whether reviewer read/understood the application (6%).
3.4 Importance of proposed criteria in defining review quality
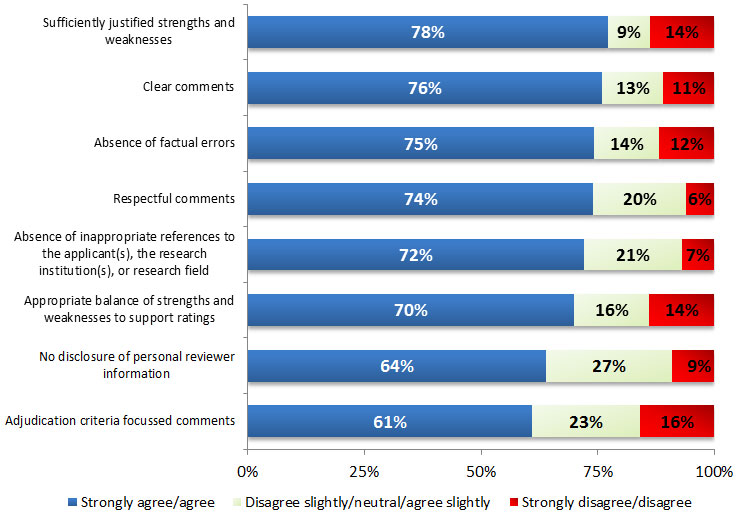
Applicants were given a variety of criteria and were asked to describe their level of agreement with the criteria being important in determining review quality. The criteria applicants most commonly agreed or strongly agreed with were sufficiently justified strengths and weaknesses (78%), Clear comments (76%), Absence of factual errors (75%), and Respectful comments (74%). The majority of applicants strongly agreed/agreed that all criteria were important.
Figure 4: Agreement with statements about the importance of aspects in defining review quality (n = 1,077)Footnote 1
Please express your level of agreement with the following criteria being important in determining review quality, from an applicant perspective
Long description
| Sufficiently justified strengths and weaknesses | Clear comments | Absence of factual errors | Respectful comments | Absence of inappropriate references to the applicant(s), the research institution(s), or research field | Appropriate balance of strengths and weaknesses to support ratings | No disclosure of personal reviewer information | Adjudication criteria focussed comments | |
|---|---|---|---|---|---|---|---|---|
| Strongly agree/agree | 78% | 76% | 75% | 74% | 72% | 70% | 64% | 61% |
| Disagree slightly/neutral/agree slightly | 9% | 13% | 14% | 20% | 21% | 16% | 27% | 23% |
| Strongly disagree/disagree | 14% | 11% | 12% | 6% | 7% | 14% | 9% | 16% |
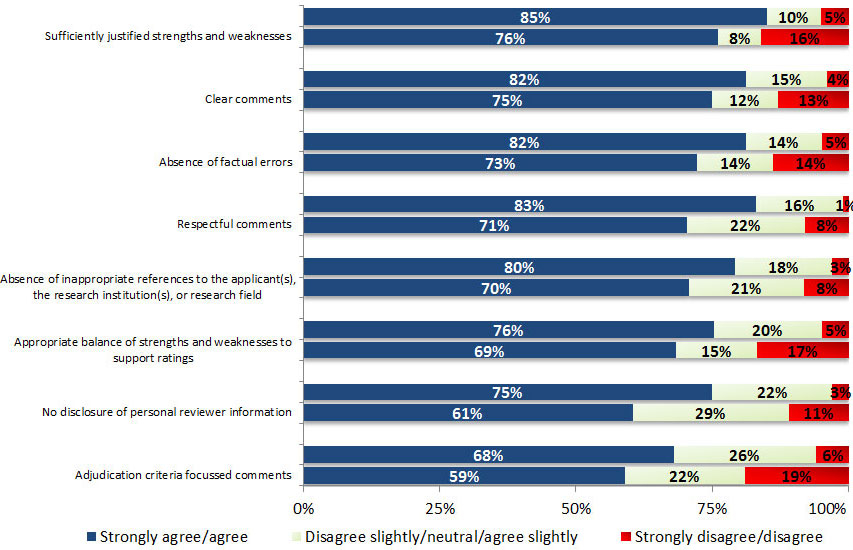
Overall, respondents receiving funding were statistically more likely than those who did not receive funding to agree or strongly agree with the importance of all of the eight criteria asked in the survey, as shown in the figure below.
Figure 5: Comparison of agreement between funded (upper bar) and non-funded (lower bar) with importance of criteria in determining review qualityFootnote 2
Please express your level agreement with the following criteria being important in determining review quality, from an applicant perspective
Long description
| Sufficiently justified strengths and weaknesses | Clear comments | Absence of factual errors | Respectful comments | Absence of inappropriate references to the applicant(s), the research institution(s), or research field | Appropriate balance of strengths and weaknesses to support ratings | No disclosure of personal reviewer information | Adjudication criteria focussed comments | |
|---|---|---|---|---|---|---|---|---|
| Strongly agree/agree | 85% | 82% | 82% | 83% | 80% | 76% | 75% | 68% |
| Disagree slightly/neutral/agree slightly | 10% | 15% | 14% | 16% | 18% | 20% | 22% | 26% |
| Strongly disagree/disagree | 5% | 4% | 5% | 1% | 3% | 5% | 3% | 6% |
| Sufficiently justified strengths and weaknesses | Clear comments | Absence of factual errors | Respectful comments | Absence of inappropriate references to the applicant(s), the research institution(s), or research field | Appropriate balance of strengths and weaknesses to support ratings | No disclosure of personal reviewer information | Adjudication criteria focussed comments | |
|---|---|---|---|---|---|---|---|---|
| Strongly agree/agree | 76% | 75% | 73% | 71% | 70% | 69% | 61% | 59% |
| Disagree slightly/neutral/agree slightly | 8% | 12% | 14% | 22% | 21% | 15% | 29% | 22% |
| Strongly disagree/disagree | 16% | 13% | 14% | 8% | 8% | 17% | 11% | 19% |
Key differences. There were many statistically significant differences among groups and their rating of the importance of criteria for reviews.
- Sex – Overall, women were more likely than men to agree or strongly agree with the importance of the various criteria in determining review quality. In particular, they were statistically more likely to agree or strongly agree in the importance of sufficiently justified strengths and weaknesses (84% women, 75% men), Clear comments (81% women, 73% men), Respectful comments (80% women, 70% men), the absence of inappropriate references (80% women, 68% men), Appropriate balance of strengths and weaknesses to support ratings (78% women, 66% men), No disclosure of personal reviewer information (70% women, 61% men), and adjudication criteria-focussed comments (69% women, 56% men).
- Career stage – Scientists in the early stages of their careers were generally more likely to agree or strongly agree in the importance of the various criteria in determining review quality. The results in Table 5 show the statistically significant differences by career stage.
| Early-career | Mid-career | Senior scientists | |
|---|---|---|---|
| Sufficiently justified strengths and weaknesses | 84% | 76% | 76% |
| Respectful comments | 74% | 72% | 75% |
| Absence of inappropriate references to the applicant, research institution, or research field | 74% | 70% | 74% |
| Appropriate balance of strengths and weaknesses to support ratings | 74% | 67% | 72% |
| Adjudication criteria-focussed comments | 69% | 57% | 59% |
- Pillar – Scientists in the social, cultural, environmental, and population health (76%) pillar were most likely to agree or strongly agree with the importance of adjudication criteria-focussed comments, followed by health systems/services (71%). This was much higher than those in biomedical (57%) or clinical (66%) domains. Those in social, cultural, environmental, and population health (83%) were also more likely to agree or strongly agree with the importance of the Absence of factual errors, compared to those in the health systems/services (77%), clinical (76%), or biomedical (72%) pillars.
3.4.1 Optional comments on criteria to determine review quality
Most applicants (82%) did not provide any additional comments on the criteria to determine review quality. Those who did most often commented that reviewers must be qualified/knowledgeable in the subject area (4%), noted a need for greater accountability for reviewers (3%), or pointed to issues with the process/rating system (3%).
3.4.2 Optional comments on additional quality indicators
Applicants were also asked to describe any additional quality indicators they believe are important in defining review quality. The most common response by far was that reviewers must be qualified/knowledgeable in the subject area (10%), followed by reviewers’ comments need to provide detail/not be brief/need to help future applications (4%). No other indicator was mentioned by more than 2% of applicants.
3.5 Agreement that criteria applied to the reviews received
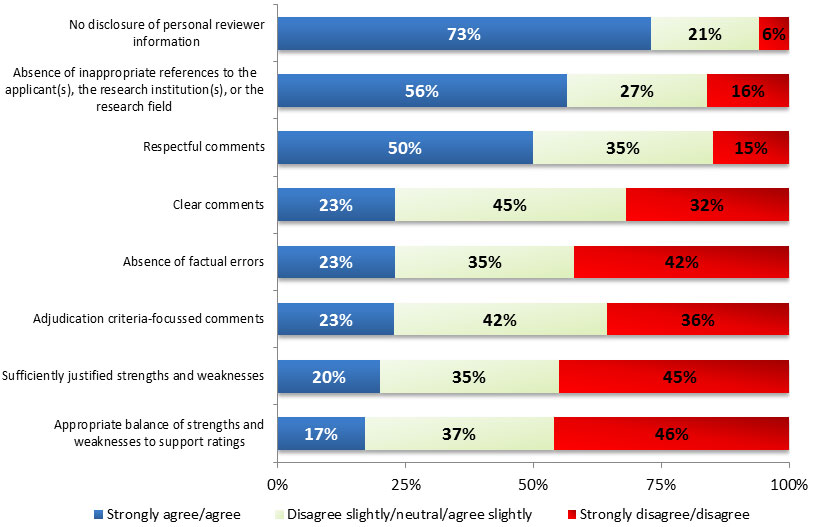
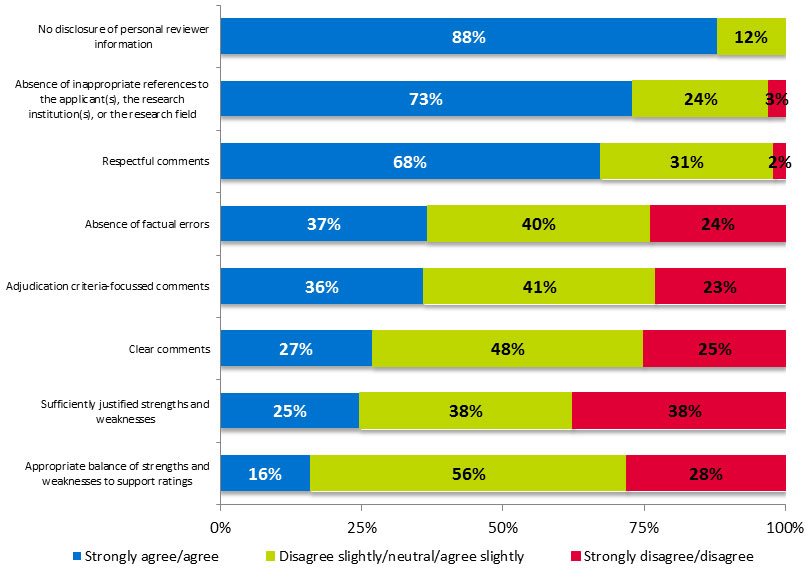
Applicants rated their level of agreement with the importance of several aspects of the review process. Applicants were most likely to agree or strongly agree that their reviews had No disclosure of personal reviewer information (73%). In contrast, applicants were least likely to agree or strongly agree that the reviews contained an Appropriate balance of strengths and weaknesses to support ratings (17%) and that they sufficiently justified strengths and weaknesses (20%). Overall, applicants were more likely to disagree than agree with five of the eight statements.
Figure 6: Agreement with which statements applied to reviews received (n = 1,077)Footnote 3
Please indicate the extent to which the following statements apply to the reviews you received
Long description
| No disclosure of personal reviewer information | Absence of inappropriate references to the applicant(s), the research institution(s), or research field | Respectful comments | Clear comments | Absence of factual errors | Adjudication criteria-focussed comments | Sufficiently justified strengths and weaknesses | Appropriate balance of strengths and weaknesses to support ratings | |
|---|---|---|---|---|---|---|---|---|
| Strongly agree/agree | 73% | 56% | 50% | 23% | 23% | 23% | 20% | 17% |
| Disagree slightly/neutral/agree slightly | 21% | 27% | 35% | 45% | 35% | 42% | 35% | 37% |
| Strongly disagree/disagree | 6% | 16% | 15% | 32% | 42% | 36% | 45% | 46% |
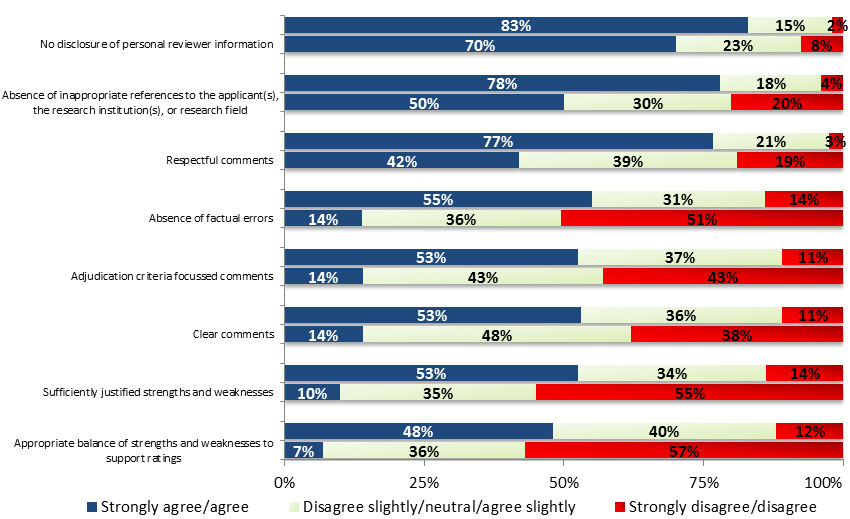
Overall, scientists receiving funding were more likely than those not receiving funding to agree or strongly agree with the extent to which various quality measures applied to the reviews they received, with gaps ranging from 13 to 43 percentage points.
Figure 7: Comparison of agreement between funded (upper bar) and non-funded (lower bar) with which statements applied to reviews receivedFootnote 4
Please indicate the extent to which the following statements apply to the reviews you received
Long description
| No disclosure of personal reviewer information | Absence of inappropriate references to the applicant(s), the research institution(s), or research field | Respectful comments | Absence of factual errors | Adjudication criteria focussed comments | Clear comments | Sufficiently justified strengths and weaknesses | Appropriate balance of strengths and weaknesses to support ratings | |
|---|---|---|---|---|---|---|---|---|
| Strongly agree/agree | 83% | 78% | 77% | 55% | 53% | 53% | 53% | 48% |
| Disagree slightly/neutral/agree slightly | 15% | 18% | 21% | 31% | 37% | 36% | 34% | 40% |
| Strongly disagree/disagree | 2% | 4% | 3% | 14% | 11% | 11% | 14% | 12% |
| No disclosure of personal reviewer information | Absence of inappropriate references to the applicant(s), the research institution(s), or research field | Respectful comments | Absence of factual errors | Adjudication criteria focussed comments | Clear comments | Sufficiently justified strengths and weaknesses | Appropriate balance of strengths and weaknesses to support ratings | |
|---|---|---|---|---|---|---|---|---|
| Strongly agree/agree | 70% | 50% | 42% | 14% | 14% | 14% | 10% | 7% |
| Disagree slightly/neutral/agree slightly | 23% | 30% | 39% | 36% | 43% | 48% | 35% | 36% |
| Strongly disagree/disagree | 8% | 20% | 19% | 51% | 43% | 38% | 55% | 57% |
Key differences. There were many statistically significant differences among groups:
- Sex – Women were more likely than men to agree or strongly agree that their review had an absence of inappropriate references (62% women, 53% men) and No disclosure of personal reviewer information (79% women, 69% men).
- Career stage – Scientists in the early stages of their careers were generally more likely to agree or strongly agree with the extent to which various quality measures applied to the reviews they received than those in mid-career or senior stages of their careers, as seen in the table below.
| % agree/strongly agree | |||
|---|---|---|---|
| Early-career | Mid-career | Senior scientists | |
| Respectful comments | 60% | 46% | 47% |
| Absence of factual errors | 33% | 18% | 22% |
| Clear comments | 31% | 19% | 23% |
| Sufficiently justified strengths and weaknesses | 29% | 17% | 18% |
| Adjudication criteria-focussed comments | 26% | 20% | 23% |
| Appropriate balance of strengths and weaknesses to support ratings | 22% | 15% | 16% |
- Pillar – For many of the questions, applicants in the biomedical domain were statistically less likely than those in the other three domains to agree/strongly agree.
| % agree/strongly agree | ||||
|---|---|---|---|---|
| Biomedical | Clinical | Health systems/ services |
Social, cultural, environmental, and population health | |
| No disclosure of personal reviewer information | 70% | 73% | 89% | 82% |
| Absence of inappropriate references to the applicant(s), the research institution(s), or the research field | 52% | 62% | 73% | 65% |
| Absence of factual errors | 19% | 33% | 30% | 28% |
| Clear comments | 19% | 30% | 29% | 33% |
| Sufficiently justified strengths and weaknesses | 18% | 23% | 20% | 28% |
| Appropriate balance of strengths and weaknesses to support ratings | 14% | 21% | 18% | 25% |
3.5.1 Optional comments on statements about reviews
Very few applicants provided additional comments on the statements’ applicability to the reviews they received, with the vast majority (87%) providing no response. The responses provided varied substantially, with the most common responses noting reviewer comprehension of the application (2%), a lack of detail in reviews (2%), variance in reviews across different reviewers (2%), and issues with inappropriate/misguided/biased comments (2%).
4.0 Stage 1 reviewer (n = 724)
This section examines responses from stage 1 reviewers.
4.1 Reading preliminary reviews
4.1.1 Read preliminary reviews
Overall, 90% of stage 1 reviewers said they read the preliminary reviews of other reviewers who were assigned the same application.
Key difference. Those in the biomedical (94%) research domain were statistically more likely to say they read the reviews than those in social, cultural, environmental, and health populations (88%), clinical (86%), and health systems/services (81%) domains.
4.1.2 Optional comments on why Stage 1 reviewers read preliminary reviews
Among those who read the reviews, respondents said they read them primarily for two reasons: to compare ratings to assess or calibrate their own ratings (44%) or to understand other reviewers’ points of view/prepare for the discussion (36%).
Reviewers also mentioned that they read them to check for important aspects they may have missed or neglected in their assessment (22%), identify discrepancies (15%), or to get information from reviewers from other disciplines/those outside their area of expertise (13%).
4.1.3 Optional comments on why Stage 1 reviewers did not read preliminary reviews
The other 9% did not read other reviews (1% did not respond to this question). Among those who did not read the reviews, most reasons were not related to the reviews themselves, but to issues rated to the reviewer, such as they did not have enough time (27%), they had technical issues accessing the reviews/getting them online (12%), or did not know how to access them (8%). The only common reason related to the process of reviewing itself was that some did not want to influence/bias their review (15%).
4.2 Unsatisfactory review
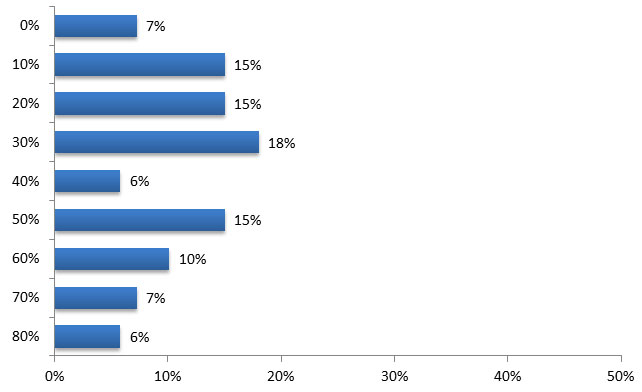
Overall, 63% of stage 1 reviewers who read the preliminary reviews said that at least some reviews were of unsatisfactory quality. However, 12% said that half of the reviews or more were of unsatisfactory quality. The biggest group was those who said between 10% and 30% were unsatisfactory accounting for 46% of those who read the preliminary reviews.
Figure 8: Percentage of preliminary reviews that were unsatisfactory (n = 658)Footnote 5
Approximately what percentage of the preliminary reviews did you feel were of unsatisfactory review quality?
Long description
| 0% | 10% | 20% | 30% | 40% | 50% | 60% | 70% | 80% | 90% | 100% | No response |
|---|---|---|---|---|---|---|---|---|---|---|---|
| 36% | 14% | 17% | 15% | 5% | 7% | 1% | 2% | 1% | 1% | <1% | 1% |
Key differences. Those in the biomedical (71%) domain were much more likely than those in the clinical (49%), social, cultural, environmental, and population health (46%), and healthy systems/services (38%) domains to say they noticed unsatisfactory reviews.
4.2.1 Optional comments regarding unsatisfactory reviews
When asked to comment on the percentage of preliminary reviews that were unsatisfactory, only 39% of stage 1 reviewers provided a comment. Those who did comment discussed many issues, most commonly related to the review itself, such as reviewers did not provide enough detail in their responses (16%), reviewers did not submit reviews or submitted them late (12%), or reviewers did not provide comments or justification of ratings (11%).
Some stage 1 reviewers also commented on the reviewers, saying that reviewers were unskilled or inexperienced conducting reviews of applications (8%), reviewers lacked proper expertise or knowledge in the area (6%), or reviewers were biased or had a conflict of interest in what they were reviewing (6%).
4.3 Important aspects of the preliminary review
The vast majority of stage 1 reviewers tended to see each of the eight aspects in defining review quality as important, most notably, Clear comments (94% strongly agreed/agreed), Respectful comments (92%), and sufficiently justified strengths and weaknesses (91%). Even at the lowest level of agreement for adjudication criteria-focussed comments (76%), more than 3 in 4 rated it as strongly agree/agree.
Figure 9: Agreement with the importance of aspects to the preliminary review (n = 724)Footnote 6
Please indicate the extent to which you agree that the following statements are important in defining review quality
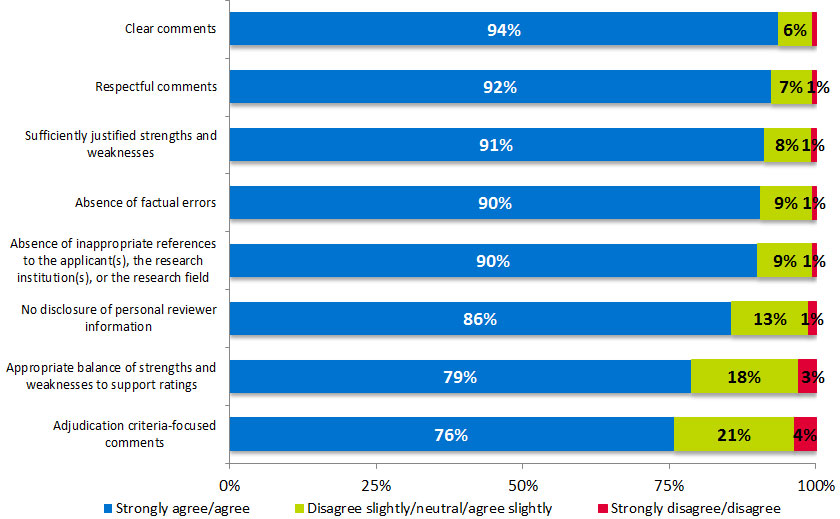
Long description
| Clear comments | Respectful comments | Sufficiently justified strengths and weaknesses | Absence of factual errors | Absence of inappropriate references to the applicant(s), the research institution(s), or research field | No disclosure of personal reviewer information | Appropriate balance of strengths and weaknesses to support ratings | Adjudication criteria focussed comments | |
|---|---|---|---|---|---|---|---|---|
| Strongly agree/agree | 94% | 92% | 91% | 90% | 90% | 86% | 79% | 76% |
| Disagree slightly/neutral/agree slightly | 6% | 7% | 8% | 9% | 9% | 13% | 18% | 21% |
| Strongly disagree/disagree | 0% | 1% | 1% | 1% | 1% | 1% | 3% | 4% |
Key differences. There are many statistically significant differences by groups for the statements above.
- Sex. Several differences by sex, with women being more likely than men to strongly agree/agree that each of the following is important: Clear comments (97% versus 91%), Respectful comments (96% versus 90%), and Absence of factual errors (95% versus 87%).
- Career stage. Those in the early stage of their career (89%) were more likely than those in the mid-stage (76%) or late stage (77%) to strongly agree/agree that an Appropriate balance of strengths and weaknesses to support ratings is important.
- Pillar. For adjudication criteria-focussed comments, those in health systems/services (85%), social, cultural, environmental, and population health (81%), and clinical (80%) domains were more likely to strongly agree/agree than those in the biomedical (70%) domain.
4.3.1 Optional comments on statements about defining review quality
When asked to comment on the statements about review quality, very few stage 1 reviewers (11%) provided any comments. In fact, no single theme was mentioned by more than 2% of respondents. In many cases, the comments related to issues with the question (e.g., all aspects are important, wording in questions is not clear) rather than defining review quality in general.
4.4 Perceptions of preliminary reviews
When asked the extent to which eight statements reflected the preliminary reviews, most stage 1 reviewers were not overly negative about the reviews. Rather, many showed signs of having issues with the majority selecting middle-scale ratings (e.g., 49% saying they agreed or disagreed slightly or are neutral that an Appropriate balance of strengths and weaknesses to support ratings was applied to preliminary reviews).
Overall, stage 1 reviewers were most likely to strongly agree/agree that no disclosure of reviewer information (85%), an absence of inappropriate references to the applicant, research institution, or research field (79%), and Respectful comments (76%) were reflected in the reviews.
Figure 10: Agreement with statements and if they apply to preliminary reviews (n = 724)Footnote 7
Please indicate the extent to which the following statements apply to the preliminary reviews you read
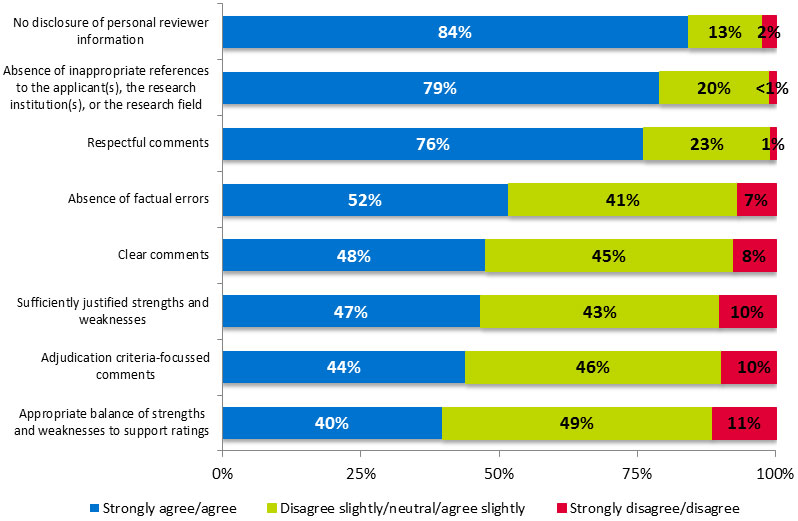
Long description
| No disclosure of personal reviewer information | Absence of inappropriate references to the applicant(s), the research institution(s), or research field | Respectful comments | Absence of factual errors | Clear comments | Sufficiently justified strengths and weaknesses | Adjudication criteria focussed comments | Appropriate balance of strengths and weaknesses to support ratings | |
|---|---|---|---|---|---|---|---|---|
| Strongly agree/agree | 84% | 79% | 76% | 52% | 48% | 47% | 44% | 40% |
| Disagree slightly/neutral/agree slightly | 13% | 20% | 23% | 41% | 45% | 43% | 46% | 49% |
| Strongly disagree/disagree | 2% | <1% | 1% | 7% | 8% | 10% | 10% | 11% |
Key differences. There were many key differences by pillar and a few by career stage.
- Career stage. Senior scientists (74%) were less likely than those in the mid-career (85%) or early-career scientists (81%) to strongly agree/agree that reviews showed an absence of inappropriate references to applicants, research institutions, or field.
- Pillar. As the table below shows, for five questions, those in the biomedical research domain were much less likely than those in the other three domains to strongly agree/agree.
| % agree/strongly agree | ||||
|---|---|---|---|---|
| Biomedical | Clinical | Health systems/ services |
Social, cultural, environmental, and population health | |
| Sufficiently justified strengths and weaknesses | 38% | 56% | 56% | 54% |
| Appropriate balance of strengths and weaknesses to support ratings | 31% | 51% | 44% | 45% |
| Adjudication criteria-focussed comments | 36% | 56% | 46% | 47% |
| Absence of factual errors | 43% | 65% | 58% | 50% |
| Clear comments | 41% | 53% | 52% | 57% |
Note: Results are shown with not applicable removed from calculations.
4.4.1 Optional comments on statements about preliminary reviews
When asked to comment on the previous rated statements about preliminary reviews, only 21% of stage 1 reviewers provided any comments. Results show that no single theme was raised by the majority of reviewers; rather, many different themes emerged. The only theme to be mentioned by more than 4% of stage 1 reviewers was that the previous set of questions (shown in Figure 10) was difficult to answer given the range in the quality of preliminary reviews (5%).
4.5 Optional comments about review quality
To end the survey, stage 1 reviewers were asked to provide any additional comments regarding quality indicators that are important for defining review quality. Similar to some of the other open-ended questions toward the end of the survey, the majority (86%) of stage 1 reviewers did not provide a response. Stage 1 reviewers tended to comment on the reviewer (as opposed to the review), indicating reviewers should be qualified/knowledgeable in the subject area (3%) or should complete reviews/complete them by the deadline (1%).
5.0 Virtual chair (n = 69)
This section examines responses from virtual chairs.
5.1 Read preliminary reviews of other reviewers
Almost all (97%) virtual chairs said they read the preliminary reviews of other reviewers who were assigned the same application.
5.2 Unsatisfactory reviews
Overall, 93% of virtual chairs who read the preliminary reviews said that at least some of the preliminary reviews they read were unsatisfactory. In fact, 39% of virtual chairs said that at least half of the preliminary reviews they read were unsatisfactory.
Figure 11: Percentage of preliminary reviews that were unsatisfactory (n = 67) Footnote 8
Approximately what percentage of the preliminary reviews did you feel were of unsatisfactory review quality?
Long description
| 0% | 10% | 20% | 30% | 40% | 50% | 60% | 70% | 80% |
|---|---|---|---|---|---|---|---|---|
| 7% | 15% | 15% | 18% | 6% | 15% | 10% | 7% | 6% |
5.2.1 Optional comments on unsatisfactory reviews
When asked to comment on the proportion of unsatisfactory reviews, 75% of virtual chairs gave a response. By far, the most common critique of unsatisfactory reviews was that reviewers did not provide enough information/detail in their responses to support their ratings (51%). Otherwise, only a few other comments were raised by more than 10% of virtual chairs, including delays in receiving the reviews (17%), a belief that poor quality reviews come from inexperienced/non-knowledgeable reviewers (15%), and the ratings provided did not match the comments (13%).
5.3 Importance of criteria in defining review quality
When asked to assess the importance of the same eight factors in terms of their importance to review quality, virtual chairs seemed to rate all eight aspects as important (by way of selecting agree or strongly agree). However, the two most important areas seem to be sufficiently justified strengths and weaknesses (96% strongly agreed/agreed – 84% alone strongly agreed) and Clear comments (93% strongly agreed/agreed – 62% alone strongly agreed).
These ratings are concerning, given that Figure 12 shows that virtual chairs rated sufficiently justified strengths and weaknesses as one of the biggest weaknesses of the preliminary reviews, as it has the highest proportion who disagreed/strongly disagreed with the statement.
Figure 12: Agreement with statements related to importance for quality reviews (n = 69)
Please indicate the extent to which you agree that the following statements are important in defining review quality
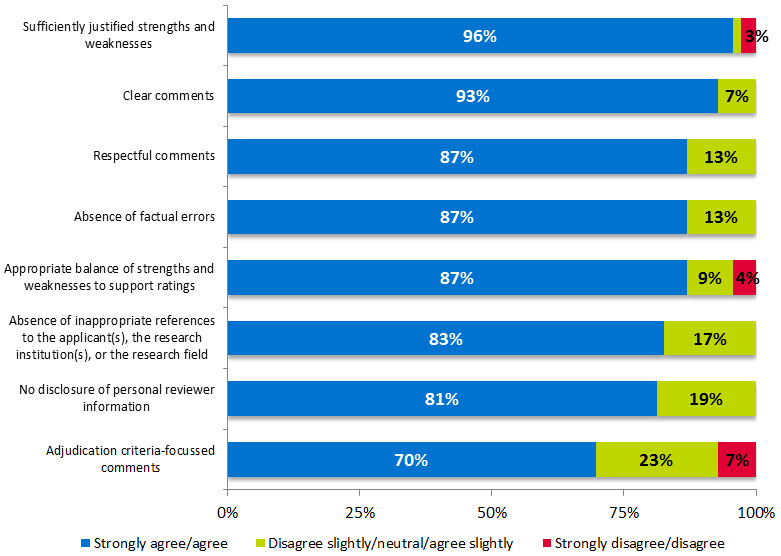
Long description
| Sufficiently justified strengths and weaknesses | Clear comments | Respectful comments | Absence of factual errors | Appropriate balance of strengths and weaknesses to support ratings | Absence of inappropriate references to the applicant(s), the research institution(s), or research field | No disclosure of personal reviewer information | Adjudication criteria focussed comments | |
|---|---|---|---|---|---|---|---|---|
| Strongly agree/agree | 96% | 93% | 87% | 87% | 87% | 83% | 81% | 70% |
| Disagree slightly/neutral/agree slightly | 1% | 7% | 13% | 13% | 9% | 17% | 19% | 23% |
| Strongly disagree/disagree | 3% | 0% | 0% | 0% | 4% | 0% | 0% | 7% |
5.3.1 Optional comments about importance of criteria
When asked to comment on the previous rated statements about review quality, most (77%) virtual chairs did not provide any comments. Even among those who did, there was no central theme that could capture what virtual chairs discussed in this question. The only two themes that were identified were all aspects rated are important (3%) and a preference for face-to-face meetings (3%).
5.4 Agreement that criteria applied to the reviews read
Virtual chairs were asked to rate their agreement with eight statements regarding the preliminary reviews they read. Results in Figure 13 show a wide range of agreement with each of the questions.
- Virtual chairs were most likely to strongly agree/agree that No disclosure of personal reviewer information applies to preliminary reviews. This includes 50% who strongly agreed.
- At the lower end, virtual chairs were less likely to strongly agree/agree that an Appropriate balance of strengths and weaknesses to support ratings (16%) applies; however, 28% disagree/strongly disagreed with this statement.
- Virtual chairs were most likely to disagree/strongly disagree that preliminary reviews sufficiently justified strengths and weaknesses (38%).
Figure 13: Agreement with statements about ability to read other reviewers’ preliminary reviews (n = 67)Footnote 9
Please indicate the extent to which the following statements apply to the preliminary reviews you read
Long description
| No disclosure of personal reviewer information | Absence of inappropriate references to the applicant(s), the research institution(s), or research field | Respectful comments | Absence of factual errors | Adjudication criteria focussed comments | Clear comments | Sufficiently justified strengths and weaknesses | Appropriate balance of strengths and weaknesses to support ratings | |
|---|---|---|---|---|---|---|---|---|
| Strongly agree/agree | 88% | 73% | 68% | 37% | 36% | 27% | 25% | 16% |
| Disagree slightly/neutral/agree slightly | 12% | 24% | 31% | 40% | 41% | 48% | 38% | 56% |
| Strongly disagree/disagree | 0% | 3% | 2% | 24% | 23% | 25% | 38% | 28% |
5.4.1 Optional comments on statements about preliminary reviews
When asked to comment on the previous rated statements about preliminary reviews, only about half of virtual chairs provided any comments. Examining results shows that there were no specific critiques or suggestions regarding preliminary reviews, with many comments simply just speaking negatively of the reviews or the process (e.g., “The structured review format was a disaster, for both applicants and the reviewers.”
).
5.5 Optional comments about review quality
To end the survey, virtual chairs were asked to provide any additional comments regarding quality indicators that are important for defining review quality. Similar to some of the other open-ended questions toward the end of the survey, the majority (59%) of virtual chairs did not provide a response. Among those who did, common themes were difficult to assess, with only a few being mentioned by several chairs. The most common suggestion was that reviewers should be knowledgeable/experienced in the area they are reviewing (12%).
6.0 Final assessment stage reviewers (n = 14)
This section examines responses from final assessment stage reviewers.
6.1 Agreement with statements about Stage 1 reviewers
Final assessment stage reviewers were consistent in disagreeing that stage 1 reviewers provided sufficient (93% strongly disagreed or disagreed) or clear (100% strongly disagreed or disagreed) feedback to support their ratings.
Figure 14: Agreement with statements about Stage 1 reviewers (n = 14)
Stage 1 reviewers...
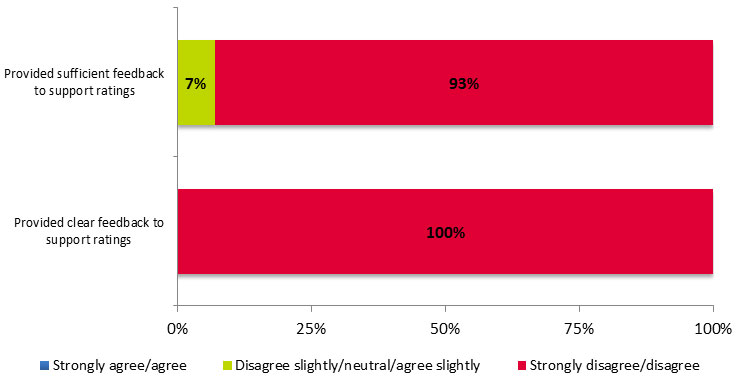
Long description
| Provided sufficient feedback to support ratings | Provided clear feedback to support ratings | |
|---|---|---|
| Strongly agree/agree | 0% | 0% |
| Disagree slightly/neutral/agree slightly | 7% | 0% |
| Strongly disagree/disagree | 93% | 100% |
6.2 Consulting grant applications
Overall, 93% of final assessment stage reviewers said they consulted the grant application in addition to the stage 1 reviews.
6.3 Reading application and Stage 1 reviews was necessary
Among the 93% of final assessment stage reviewers who consulted the grant application in addition to the stage 1 reviews, 85% strongly agreed/agreed that reading both the application and stage 1 reviews was necessary for the final assessment stage. This includes 69% who strongly agreed with this statement.
Figure 15: Agreement that application and Stage 1 reviews were necessary (n = 13)Footnote 10
Reading both the application and Stage 1 reviews was necessary for the Final Assessment Stage
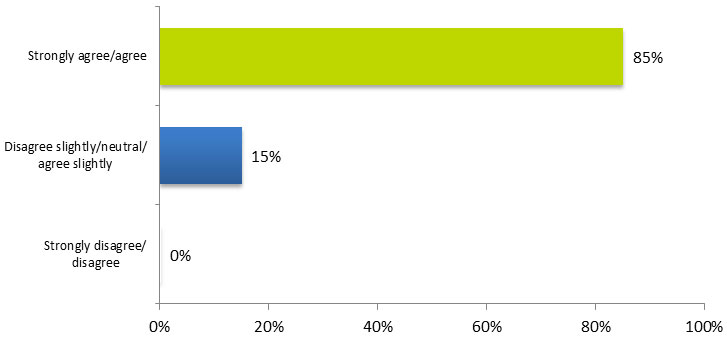
Long description
| Strongly agree/agree | Disagree slightly/neutral/agree slightly | Strongly disagree/disagree |
|---|---|---|
| 85% | 15% | 0% |
6.4 Optional comments on usefulness of Stage 1 reviews
When asked to comment on the usefulness of stage 1 reviews for the final assessment stage, respondents most commonly commented that reviewers did not provide enough detail/information in their reviews to be useful (57%), or that reviewers were not knowledgeable in the subject area (36%). A fair proportion also said that many reviews were not submitted or were submitted late (29%).
7.0 Key findings
This section summarizes the key findings from the research, synthesizing results from the four surveys of stakeholders.
7.1 Importance of determining review quality
The figure below compares the proportion of each stakeholder group that strongly agreed/agreed with the importance of each statement. Results show that two areas (sufficiently justified strengths and weaknesses and Clear comments) tend to be the two most important aspects among each group (Respectful comments ranks just ahead of sufficiently justified strengths and weaknesses for stage 1 reviewers).
On the other hand, stakeholders seemed to place less emphasis on No disclosure of personal reviewer information and adjudication criteria-focussed comments.
Figure 16: Agree and strongly agree ratings with statements related to importance for quality reviews by stakeholder group
Please express your level of agreement with the following criteria being important in determining review quality
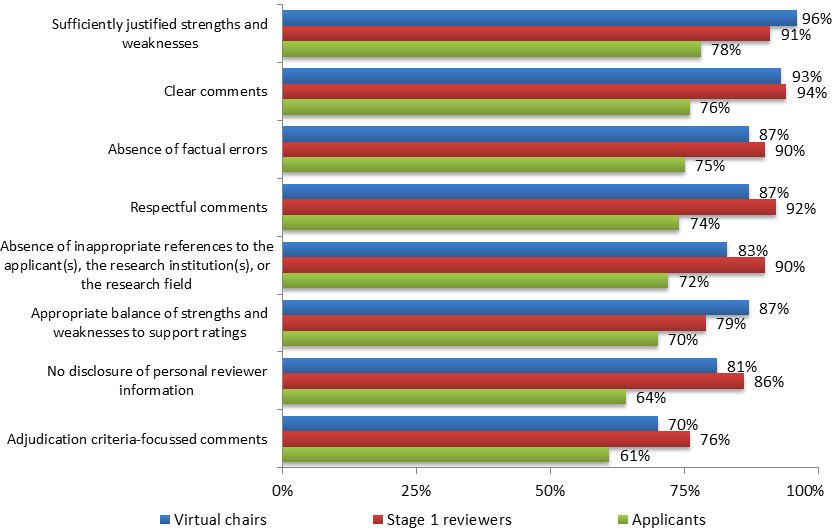
Long description
| Sufficiently justified strengths and weaknesses | Clear comments | Absence of factual errors | Respectful comments | Absence of inappropriate references to the applicant(s), the research institution(s), or research field | Appropriate balance of strengths and weaknesses to support ratings | No disclosure of personal reviewer information | Adjudication criteria focussed comments | |
|---|---|---|---|---|---|---|---|---|
| Virtual chairs | 96% | 93% | 87% | 87% | 83% | 87% | 81% | 70% |
| Stage 1 reviewers | 91% | 94% | 90% | 92% | 90% | 79% | 86% | 76% |
| Applicants | 78% | 76% | 75% | 74% | 72% | 70% | 64% | 61% |
7.2 Key areas for improvement
Based on qualitative comments, the following themes seem to be consistent across stakeholder groups:
- Lack of quality feedback from reviewers – Both applicants, reviewers, and chairs noted that many reviews were lacking in substance and detail. The lack of detail in their comments seems to have caused two major issues for applicants. First, the lack of detail often meant that the comments given did not match the reviewers’ ratings of the application. Many applicants mentioned that comments were often a sentence or two, without any negative feedback or constructive criticism, yet the reviewers’ ratings were lower than O++ or O+. The other issue this seems to have created is that applicants were not given any insight into how to improve future applications or potentially understand if the issues were too great to even try to re-apply with changes to their team, methodology, approach, etc. Indeed, when assessing the strengths of the review, all stakeholders noted that appropriate balance of strengths and weakness to support ratings was the least successful aspects of the process.
- Perceived qualifications of reviewers – Applicants, and even some reviewers and chairs, implied that many of the perceived poor reviews came from individuals who lacked the proper knowledge or expertise in the proposed applicants’ area of research. This was often backed up with references to reviewers who made comments that respondents deemed to be factually incorrect or simply based on opinion rather than facts.
- Issues related to timing for reviews – Many reviewers and chairs identified issues related to the timing for reviews, noting that many reviews were submitted very close to the deadline (which does not allow reviewers enough time to read other reviews), and in some cases were not submitted at all. Some reviewers and chairs noted that reviewers may not have had enough time to review applications properly, or had too many applications to review in the time limits. This may have impacted the quality of reviews and amount of detail provided, but also may be linked to a reoccurring issue among applicants that they suspected that some reviewers did not take time to read the application in detail, as they noted errors in the review (e.g., identifying information that was missing that was already contained in the application, referring to information that was not in their application, etc.).
Appendix A – Applicant Survey Results
| % (n=1,077) |
|
|---|---|
| Female | 37% |
| Male | 63% |
Note: Due to rounding, total may not sum to 100%.
| % (n=1,077) |
|
|---|---|
| Early-career scientist (≤5 years as an independent researcher) | 25% |
| Mid-career scientist (5-15 years as an independent researcher) | 42% |
| Senior scientist (>15 years as an independent researcher) | 33% |
Note: Respondents could provide more than one answer; totals may sum to more than 100%.
| % (n=1,077) |
|
|---|---|
| Professor | 41% |
| Associate professor | 32% |
| Assistant professor | 25% |
| Researcher | 12% |
| Clinician | 8% |
| Scientist | 7% |
| Senior scientist | 6% |
| Research administrator | 2% |
| Dean of research | <1% |
| Other | 2% |
Note: Respondents could provide more than one answer; totals may sum to more than 100%.
| % (n=1,070) |
|
|---|---|
| Biomedical | 69% |
| Clinical | 14% |
| Social, cultural, environmental and population health | 10% |
| Health systems/services | 8% |
Note: Due to rounding, total may not sum to 100%.
Those who answered “Not applicable”
have been removed from the calculations.
| % (n=1,077) |
|
|---|---|
| Yes | 23% |
| No | 77% |
Note: Due to rounding, total may not sum to 100%.
| % (n=1,072) |
|
|---|---|
| Strongly agree | 5% |
| Agree | 16% |
| Agree slightly | 9% |
| Neutral | 6% |
| Disagree slightly | 10% |
| Disagree | 22% |
| Strongly disagree | 33% |
Note: Due to rounding, total may not sum to 100%.
Those who answered “Not applicable”
have been removed from the calculations.
| % (n=1,077) |
|
|---|---|
| Too much variance/deviation between reviewers | 18% |
| Comments did not match ratings | 12% |
| Reviewers lacked proper expertise/knowledge in area | 8% |
| Reviewers do not provide enough detail in responses | 7% |
| Unclear how ratings are used to calculate rankings | 7% |
| Reviewers did not provide comments or justification of rating | 6% |
| Generally negative comments about process/ratings | 4% |
| No clear guidelines for how reviewers should assign ratings | 3% |
| Questioned whether reviewer read/understood the application | 3% |
| Do not like the ratings/codes | 2% |
| Reviewers are biased in rating | 2% |
| Suggest new methods for rating | 2% |
| Could not associate comments with reviewers’ ranking | 1% |
| Received too few reviews | 1% |
| Not enough understanding of basic research | 1% |
| Should require face-to-face discussion when discrepancies between reviewers | 1% |
| Reviewers provided detailed comments to justify ratings | 1% |
| General positive comments about reviews | 1% |
| Good consistency between reviewers | <1% |
| Other | 3% |
| No response | 43% |
Note: Respondents could provide more than one answer; totals may sum to more than 100%.
| % (n=1,006) |
|
|---|---|
| Strongly agree | 3% |
| Agree | 13% |
| Agree slightly | 15% |
| Neutral | 8% |
| Disagree slightly | 8% |
| Disagree | 20% |
| Strongly disagree | 33% |
Note: Due to rounding, total may not sum to 100%.
Those who answered “Not applicable”
have been removed from the calculations.
| % (n=1,077) |
|
|---|---|
| Comments were irrelevant/lacked proper insight | 14% |
| Majority of comments did not provide enough information to improve future applications | 10% |
| General negative comments | 8% |
| Comments were inconsistent between reviewers | 7% |
| Only some reviewers provided useful information | 7% |
| No negative comments/improvements were noted in comments | 6% |
| Difficult to address concerns with page/character limitations | 4% |
| Question the depth to which reviewers read the application | 4% |
| Received enough information to be able to resubmit with changes | 3% |
| Not applicable/received funding | 1% |
| Reviewers did not provide comments at all | 1% |
| Other | 3% |
| No response | 42% |
Note: Respondents could provide more than one answer; totals may sum to more than 100%.
| % (n=1,077) |
|
|---|---|
| 0% | 9% |
| 10% | 4% |
| 20% | 11% |
| 30% | 11% |
| 40% | 5% |
| 50% | 21% |
| 60% | 6% |
| 70% | 11% |
| 80% | 10% |
| 90% | 4% |
| 100% | 7% |
| No response | <1% |
Note: Due to rounding, total may not sum to 100%.
| % (n=1,077) |
|
|---|---|
| Reviewers do not provide enough detail in responses to understand weakness/make improvements | 10% |
| Unsatisfactory reviews came from reviewers who were not qualified/knowledgeable in the area of research | 9% |
| Questioned whether reviewer read/understood the application | 6% |
| Too much variance/deviation between reviewers | 3% |
| Reviewers provided opinions rather than factual basis for comments | 3% |
| Comments did not match ratings | 2% |
| Reviews are not the issue, but how ratings/rankings lead to funding is the problem | 2% |
| Reviewers did not understand limitations of the grant application (e.g., space limits) | 2% |
| Overall negative comments | 2% |
| Need for face-to-face meetings | 2% |
| All/majority of reviews provided useful feedback | 2% |
| Just provides the number of unsatisfactory reviews to provide further detail to previous question | 2% |
| Missing or incomplete reviews | 1% |
| Other | 2% |
| No response | 64% |
Note: Respondents could provide more than one answer; totals may sum to more than 100%.
| % (n=1,063) |
|
|---|---|
| Strongly agree | 53% |
| Agree | 25% |
| Agree slightly | 4% |
| Neutral | 2% |
| Disagree slightly | 2% |
| Disagree | 6% |
| Strongly disagree | 8% |
Note: Due to rounding, total may not sum to 100%.
Those who answered “Not applicable”
have been removed from the calculations.
| % (n=1,057) |
|
|---|---|
| Strongly agree | 41% |
| Agree | 29% |
| Agree slightly | 7% |
| Neutral | 6% |
| Disagree slightly | 3% |
| Disagree | 5% |
| Strongly disagree | 9% |
Note: Due to rounding, total may not sum to 100%.
Those who answered “Not applicable”
have been removed from the calculations.
| % (n=1,055) |
|
|---|---|
| Strongly agree | 31% |
| Agree | 30% |
| Agree slightly | 11% |
| Neutral | 8% |
| Disagree slightly | 3% |
| Disagree | 6% |
| Strongly disagree | 10% |
| No response | <1% |
Note: Due to rounding, total may not sum to 100%.
Those who answered “Not applicable”
have been removed from the calculations.
| % (n=1,050) |
|
|---|---|
| Strongly agree | 55% |
| Agree | 20% |
| Agree slightly | 3% |
| Neutral | 7% |
| Disagree slightly | 3% |
| Disagree | 3% |
| Strongly disagree | 8% |
Note: Due to rounding, total may not sum to 100%.
Those who answered “Not applicable”
have been removed from the calculations.
| % (n=1,062) |
|
|---|---|
| Strongly agree | 50% |
| Agree | 27% |
| Agree slightly | 6% |
| Neutral | 4% |
| Disagree slightly | 3% |
| Disagree | 3% |
| Strongly disagree | 8% |
Note: Due to rounding, total may not sum to 100%.
Those who answered “Not applicable”
have been removed from the calculations.
| % (n=1,059) |
|
|---|---|
| Strongly agree | 46% |
| Agree | 28% |
| Agree slightly | 8% |
| Neutral | 10% |
| Disagree slightly | 2% |
| Disagree | 2% |
| Strongly disagree | 4% |
Note: Due to rounding, total may not sum to 100%.
Those who answered “Not applicable”
have been removed from the calculations.
| % (n=1,038) |
|
|---|---|
| Strongly agree | 46% |
| Agree | 27% |
| Agree slightly | 7% |
| Neutral | 11% |
| Disagree slightly | 2% |
| Disagree | 2% |
| Strongly disagree | 5% |
Note: Due to rounding, total may not sum to 100%.
Those who answered “Not applicable”
have been removed from the calculations.
| % (n=1,016) |
|
|---|---|
| Strongly agree | 38% |
| Agree | 27% |
| Agree slightly | 6% |
| Neutral | 19% |
| Disagree slightly | 2% |
| Disagree | 2% |
| Strongly disagree | 6% |
Note: Due to rounding, total may not sum to 100%.
Those who answered “Not applicable”
have been removed from the calculations.
| % (n=1,077) |
|
|---|---|
| Reviewers must be qualified/knowledgeable in subject area | 4% |
| Reviewers' comments need to provide detail/not be brief | 2% |
| Greater accountability for reviewers | 3% |
| Preference for face-to-face committees | 2% |
| Issues with reviewers’ adherence to criteria | 2% |
| Issues with the process/rating system | 3% |
| Generally negative comments | 1% |
| All criteria listed above are important | 1% |
| Prior system was better than current system | 1% |
| Reviews were excellent/no issues | 1% |
| Question(s) are poor/biased | 1% |
| Other | 2% |
| No response | 82% |
Note: Respondents could provide more than one answer; totals may sum to more than 100%.
| % (n=1,077) |
|
|---|---|
| Reviewers must be qualified/knowledgeable in subject area | 10% |
| Reviewers' comments need to provide detail/not be brief/need to help future applications | 4% |
| Preference for face-to-face committees | 2% |
| Reviewers must not be biased/base ratings on facts, not opinions | 2% |
| More calibration between reviewers/discussion between reviewers | 2% |
| Reviews should be reviewed for accuracy, consistency, etc. by another reviewer/chair | 1% |
| Greater accountability for reviewers | 1% |
| Consistency between ratings and comments | 1% |
| Greater consideration of the applicant’s CV/resume/history | 1% |
| Generally negative comments | 1% |
| Prior system was better than current system | <1% |
| Better reasoning for how ratings correspond to rankings | 1% |
| Give reviewers more time to conduct reviews | <1% |
| Greater consideration for innovation | <1% |
| Suggests other models for assessing applications | 1% |
| Other | 3% |
| No response | 75% |
Note: Respondents could provide more than one answer; totals may sum to more than 100%.
| % (n=1,055) |
|
|---|---|
| Strongly agree | 3% |
| Agree | 16% |
| Agree slightly | 14% |
| Neutral | 8% |
| Disagree slightly | 13% |
| Disagree | 21% |
| Strongly disagree | 24% |
| No response | <1% |
Note: Due to rounding, total may not sum to 100%.
Those who answered “Not applicable”
have been removed from the calculations.
| % (n=1,053) |
|
|---|---|
| Strongly agree | 3% |
| Agree | 14% |
| Agree slightly | 12% |
| Neutral | 10% |
| Disagree slightly | 15% |
| Disagree | 20% |
| Strongly disagree | 26% |
Note: Due to rounding, total may not sum to 100%.
Those who answered “Not applicable”
have been removed from the calculations.
| % (n=1,048) |
|
|---|---|
| Strongly agree | 4% |
| Agree | 19% |
| Agree slightly | 13% |
| Neutral | 16% |
| Disagree slightly | 13% |
| Disagree | 17% |
| Strongly disagree | 19% |
| No response | <1% |
Note: Due to rounding, total may not sum to 100%.
Those who answered “Not applicable”
have been removed from the calculations.
| % (n=1,026) |
|
|---|---|
| Strongly agree | 6% |
| Agree | 17% |
| Agree slightly | 9% |
| Neutral | 14% |
| Disagree slightly | 11% |
| Disagree | 16% |
| Strongly disagree | 26% |
| No response | <1% |
Note: Due to rounding, total may not sum to 100%.
Those who answered “Not applicable”
have been removed from the calculations.
| % (n=1,049) |
|
|---|---|
| Strongly agree | 5% |
| Agree | 18% |
| Agree slightly | 15% |
| Neutral | 18% |
| Disagree slightly | 13% |
| Disagree | 14% |
| Strongly disagree | 18% |
Note: Due to rounding, total may not sum to 100%.
Those who answered “Not applicable”
have been removed from the calculations.
| % (n=1,044) |
|
|---|---|
| Strongly agree | 16% |
| Agree | 34% |
| Agree slightly | 12% |
| Neutral | 17% |
| Disagree slightly | 5% |
| Disagree | 6% |
| Strongly disagree | 10% |
Note: Due to rounding, total may not sum to 100%.
Those who answered “Not applicable”
have been removed from the calculations.
| % (n=1,016) |
|
|---|---|
| Strongly agree | 22% |
| Agree | 34% |
| Agree slightly | 7% |
| Neutral | 16% |
| Disagree slightly | 5% |
| Disagree | 6% |
| Strongly disagree | 11% |
Note: Due to rounding, total may not sum to 100%.
Those who answered “Not applicable”
have been removed from the calculations.
| % (n=964) |
|
|---|---|
| Strongly agree | 38% |
| Agree | 35% |
| Agree slightly | 6% |
| Neutral | 14% |
| Disagree slightly | 1% |
| Disagree | 2% |
| Strongly disagree | 5% |
Note: Due to rounding, total may not sum to 100%.
Those who answered “Not applicable”
have been removed from the calculations.
| % (n=1,077) |
|
|---|---|
| Questioned whether reviewer read/understood the application | 2% |
| Reviewers do not provide enough detail in comments to understand weakness/make improvements | 2% |
| Too much variance/deviation between reviewers | 2% |
| Reviewers provided inappropriate/misguided/biased comments | 2% |
| Unsatisfactory reviews came from reviewers who were not qualified/knowledgeable in the area of research | 1% |
| Comments did not match ratings | 1% |
| Reviewers provided opinions rather than factual basis for comments | <1% |
| Reviews are not the issue, but how ratings/rankings lead to funding is the problem | 1% |
| Overall negative comments | 1% |
| Missing or incomplete reviews | <1% |
| Reviewers need to be held more accountable | <1% |
| Need for face-to-face meetings | <1% |
| General positive comments about reviewers | <1% |
| Just provides the number of poor reviews to provide further detail to previous question | 1% |
| Other | 2% |
| No response | 86% |
Note: Respondents could provide more than one answer; totals may sum to more than 100%.
Appendix B – Stage 1 Reviewers Survey Results
| % (n=724) |
|
|---|---|
| Female | 44% |
| Male | 56% |
Note: Due to rounding, total may not sum to 100%.
| % (n=724) |
|
|---|---|
| Early-career scientist (≤5 years as an independent researcher) | 10% |
| Mid-career scientist (5-15 years as an independent researcher) | 41% |
| Senior scientist (>15 years as an independent researcher) | 43% |
| Knowledge user | 4% |
| Other | 2% |
Note: Respondents could provide more than one answer; totals may sum to more than 100%.
| % (n=724) |
|
|---|---|
| Professor | 45% |
| Associate professor | 33% |
| Researcher | 18% |
| Assistant professor | 15% |
| Clinician | 13% |
| Senior scientist | 7% |
| Scientist | 4% |
| Research administrator | 4% |
| Dean of research (includes Vice-Dean, Associate Dean, Associate Chair, etc.) | 1% |
| Department Head/Chair | 1% |
| Professor emerita | <1% |
| Other | 4% |
Note: Respondents could provide more than one answer; totals may sum to more than 100%.
| % (n=710) |
|
|---|---|
| Biomedical | 48% |
| Clinical | 27% |
| Social, cultural, environmental and population health | 14% |
| Health systems/services | 12% |
Note: Due to rounding, total may not sum to 100%.
Those who answered “Not applicable”
have been removed from the calculations.
| % (n=724) |
|
|---|---|
| Yes | 90% |
| No | 9% |
| No response | 1% |
Note: Due to rounding, total may not sum to 100%.
| % (n=648) |
|
|---|---|
| To compare ratings to assess or calibrate | 44% |
| To understand other reviewers’ points of view/prepare for discussion | 36% |
| To check if there are important aspects I missed/neglected in my assessment | 22% |
| To identify discrepancies | 15% |
| To get information from reviewers from other disciplines/outside my area of expertise | 13% |
| Necessary for the process/right thing to do | 8% |
| To help reach consensus/assure fair assessment | 6% |
| Complaints about current process | 5% |
| Part of the learning process/first time as a reviewer | 4% |
| Requested by Virtual Chair | 2% |
| Just for interest/curiosity/information | 2% |
| Other | 2% |
| No response | 9% |
Note: Respondents could provide more than one answer; totals may sum to more than 100%.
Base: Stage 1 reviewers who read other preliminary reviews.
| % (n=66) |
|
|---|---|
| Not enough time to read them | 27% |
| Did not want to influence/bias my review | 15% |
| Did read them/only read some | 12% |
| Technical issues accessing other reviews/getting online | 12% |
| Did not know how to access them/that they were available | 8% |
| Other reviews were not available/joined process too late | 8% |
| Complaints about current process | 8% |
| Waste of time to read them all | 4% |
| Other | 3% |
| No response | 24% |
Note: Respondents could provide more than one answer; totals may sum to more than 100%.
Base: Stage 1 reviewers who did not read other preliminary reviews.
| % (n=724) |
|
|---|---|
| Always | 26% |
| When there were discordant/differing ratings | 16% |
| To validate my judgement/compare concerns with others | 4% |
| When I had a lack of experience in the area | 4% |
| As long as time allowed for it | 2% |
| To prepare for discussions | 2% |
| In absence of face-to-face discussions | 2% |
| Only after submitting my own review | 1% |
| For general information/curiosity/information | 1% |
| If asked to by Virtual Chair | 1% |
| Other | 2% |
| Never | <1% |
| No response | 45% |
Note: Respondents could provide more than one answer; totals may sum to more than 100%.
| % (n=658) |
|
|---|---|
| Yes | 64% |
| No | 36% |
| No response | 1% |
Note: Due to rounding, total may not sum to 100%.
BASE: Stage 1 reviewers who read preliminary reviews.
| % (n=658) |
|
|---|---|
| 0% | 36% |
| 10% | 14% |
| 20% | 17% |
| 30% | 15% |
| 40% | 5% |
| 50% | 7% |
| 60% | 1% |
| 70% | 2% |
| 80% | 1% |
| 90% | 1% |
| 100% | <1% |
| No response | 1% |
Note: Due to rounding, total may not sum to 100%.
BASE: Stage 1 reviewers who read preliminary reviews.
| % (n=724) |
|
|---|---|
| Reviewers do not provide enough detail in responses | 16% |
| Reviews not submitted/submitted late | 12% |
| Reviewers did not provide comments or justification of rating | 10% |
| Reviewers were unskilled/inexperienced | 8% |
| Reviewers were biased/conflict of interest in their reviews | 6% |
| Reviewers lacked proper expertise/knowledge in area | 6% |
| Reviewers did not give enough time to review/too many reviews | 5% |
| Comments did not match ratings | 3% |
| Reviewers are not giving applicants enough comments to make changes/applicants deserve proper review | 2% |
| Prefer face-to-face reviews | 2% |
| Dissatisfaction with the online discussion | 2% |
| Other | 2% |
| No response | 61% |
Note: Respondents could provide more than one answer; totals may sum to more than 100%.
| % (n=641) |
|
|---|---|
| Strongly agree | 3% |
| Agree | 43% |
| Agree slightly | 22% |
| Neutral | 10% |
| Disagree slightly | 10% |
| Disagree | 7% |
| Strongly disagree | 3% |
| No response | <1% |
Note: Due to rounding, total may not sum to 100%. Those who answered “Not applicable”
have been removed from the calculations.
| % (n=640) |
|
|---|---|
| Strongly agree | 3% |
| Agree | 36% |
| Agree slightly | 24% |
| Neutral | 13% |
| Disagree slightly | 12% |
| Disagree | 8% |
| Strongly disagree | 3% |
| No response | <1% |
Note: Due to rounding, total may not sum to 100%. Those who answered “Not applicable”
have been removed from the calculations.
| % (n=638) |
|
|---|---|
| Strongly agree | 5% |
| Agree | 39% |
| Agree slightly | 23% |
| Neutral | 15% |
| Disagree slightly | 9% |
| Disagree | 6% |
| Strongly disagree | 4% |
| No response | <1% |
Note: Due to rounding, total may not sum to 100%.
Those who answered “Not applicable”
have been removed from the calculations.
| % (n=622) |
|
|---|---|
| Strongly agree | 8% |
| Agree | 44% |
| Agree slightly | 15% |
| Neutral | 18% |
| Disagree slightly | 8% |
| Disagree | 4% |
| Strongly disagree | 2% |
| No response | <1% |
Note: Due to rounding, total may not sum to 100%.
Those who answered “Not applicable”
have been removed from the calculations.
| % (n=640) |
|
|---|---|
| Strongly agree | 6% |
| Agree | 41% |
| Agree slightly | 22% |
| Neutral | 14% |
| Disagree slightly | 8% |
| Disagree | 5% |
| Strongly disagree | 3% |
| No response | <1% |
Note: Due to rounding, total may not sum to 100%.
Those who answered “Not applicable”
have been removed from the calculations.
| % (n=640) |
|
|---|---|
| Strongly agree | 20% |
| Agree | 56% |
| Agree slightly | 12% |
| Neutral | 8% |
| Disagree slightly | 3% |
| Disagree | 1% |
| Strongly disagree | <1% |
| No response | <1% |
Note: Due to rounding, total may not sum to 100%. Those who answered “Not applicable”
have been removed from the calculations.
| % (n=629) |
|
|---|---|
| Strongly agree | 30% |
| Agree | 49% |
| Agree slightly | 9% |
| Neutral | 8% |
| Disagree slightly | 2% |
| Disagree | 1% |
| Strongly disagree | <1% |
| No response | <1% |
Note: Due to rounding, total may not sum to 100%. Those who answered “Not applicable”
have been removed from the calculations.
| % (n=620) |
|
|---|---|
| Strongly agree | 37% |
| Agree | 47% |
| Agree slightly | 5% |
| Neutral | 7% |
| Disagree slightly | 2% |
| Disagree | 1% |
| Strongly disagree | 1% |
| No response | <1% |
Note: Due to rounding, total may not sum to 100%. Those who answered “Not applicable”
have been removed from the calculations.
| % (n=724) |
|
|---|---|
| Difficult to answer questions because of the range in quality of reviews | 5% |
| Reviewers lacked proper expertise/knowledge in area | 3% |
| Reviewers do not provide enough detail in responses | 2% |
| Most reviews were respectful/well written | 2% |
| Reviewers did not provide comments or justification of rating | 2% |
| Reviews not submitted/submitted late | 2% |
| Concerns with disclosure of reviewers identities to applicants | 2% |
| General positive comments about quality of reviews | 1% |
| Most reviews provided appropriate detail in identifying strengths and weaknesses | 1% |
| Dissatisfaction with the online discussion | 1% |
| Reviewers did not provide criteria focused comments/misunderstood criteria | 1% |
| Reviewers lacked consensus/too much variance between reviewers | 1% |
| Reviewers did not give enough time to review/too many reviews | 1% |
| Limited interest in answering questions/not enough information to answer | 1% |
| Prefer face-to-face reviews | 1% |
| Concerns raised about ratings/criteria for ratings | 1% |
| Does not understand some of the questions listed | <1% |
| Comments did not match ratings | <1% |
| Feels disclosure of reviewers’ information to other reviewers is appropriate | <1% |
| Ratings for previous questions based only on good reviewers | <1% |
| Other | 2% |
| No response | 79% |
Note: Respondents could provide more than one answer; totals may sum to more than 100%.
| % (n=717) |
|
|---|---|
| Strongly agree | 53% |
| Agree | 38% |
| Agree slightly | 5% |
| Neutral | 2% |
| Disagree slightly | 1% |
| Disagree | <1% |
| Strongly disagree | <1% |
Note: Due to rounding, total may not sum to 100%. Those who answered “Not applicable”
have been removed from the calculations.
| % (n=717) |
|
|---|---|
| Strongly agree | 36% |
| Agree | 42% |
| Agree slightly | 8% |
| Neutral | 8% |
| Disagree slightly | 3% |
| Disagree | 2% |
| Strongly disagree | 1% |
Note: Due to rounding, total may not sum to 100%. Those who answered “Not applicable”
have been removed from the calculations.
| % (n=710) |
|
|---|---|
| Strongly agree | 32% |
| Agree | 44% |
| Agree slightly | 10% |
| Neutral | 8% |
| Disagree slightly | 2% |
| Disagree | 2% |
| Strongly disagree | 1% |
Note: Due to rounding, total may not sum to 100%. Those who answered “Not applicable”
have been removed from the calculations.
| % (n=707) |
|
|---|---|
| Strongly agree | 51% |
| Agree | 39% |
| Agree slightly | 4% |
| Neutral | 4% |
| Disagree slightly | <1% |
| Disagree | <1% |
| Strongly disagree | <1% |
| No response | <1% |
Note: Due to rounding, total may not sum to 100%. Those who answered “Not applicable”
have been removed from the calculations.
| % (n=718) |
|
|---|---|
| Strongly agree | 52% |
| Agree | 41% |
| Agree slightly | 3% |
| Neutral | 2% |
| Disagree slightly | <1% |
| Disagree | <1% |
| Strongly disagree | <1% |
| No response | <1% |
Note: Due to rounding, total may not sum to 100%. Those who answered “Not applicable”
have been removed from the calculations.
| % (n=717) |
|
|---|---|
| Strongly agree | 55% |
| Agree | 37% |
| Agree slightly | 4% |
| Neutral | 3% |
| Disagree slightly | <1% |
| Disagree | <1% |
| Strongly disagree | <1% |
Note: Due to rounding, total may not sum to 100%. Those who answered “Not applicable”
have been removed from the calculations.
| % (n=709) |
|
|---|---|
| Strongly agree | 53% |
| Agree | 37% |
| Agree slightly | 4% |
| Neutral | 5% |
| Disagree slightly | <1% |
| Disagree | <1% |
| Strongly disagree | <1% |
Note: Due to rounding, total may not sum to 100%. Those who answered “Not applicable”
have been removed from the calculations.
| % (n=710) |
|
|---|---|
| Strongly agree | 51% |
| Agree | 35% |
| Agree slightly | 5% |
| Neutral | 8% |
| Disagree slightly | <1% |
| Disagree | 1% |
| Strongly disagree | 1% |
Note: Due to rounding, total may not sum to 100%. Those who answered “Not applicable”
have been removed from the calculations.
| % (n=724) |
|
|---|---|
| All are important/define what a good review should be | 2% |
| Strengths and weaknesses should be included, but do not need to be balanced | 2% |
| Concerns raised about the criteria/ratings system for assessing applications | 2% |
| Balancing strengths and weaknesses provides a clearer assessment for applicants | 1% |
| Rating system needs clearer definition between ratings | 1% |
| Unclear on how to define words used in questions (e.g., sufficient, appropriate) | 1% |
| Quality of the reviewer is most important aspects for a quality review | 1% |
| Prefer face-to-face reviews | 1% |
| Should not disclose information about reviewer to applicants | 1% |
| No comments/already provided answers | <1% |
| Open to open review/applicants knowing names of reviewers | <1% |
| Other | 2% |
| No response | 89% |
Note: Respondents could provide more than one answer; totals may sum to more than 100%.
| % (n=724) |
|
|---|---|
| Reviewers must be qualified/knowledgeable in subject area | 3% |
| Reviewers should provide quality feedback on reviews | 2% |
| Reviewers should provide feedback to applicants to allow them to understand weaknesses/improve future applications | 2% |
| Reviewers should complete reviews/respect deadlines | 1% |
| Comments should be supported with references to scientific literature | 1% |
| Provide adequate time to review applications | 1% |
| Suggestions for different/previously used scoring systems | 1% |
| Provide more information to reviewers (e.g., previous research of applicants, other grants held, etc.) | 1% |
| General negative comments about the review/application process | 1% |
| Prefer face-to-face reviews | 1% |
| Issues with Virtual Chair | <1% |
| Other | 2% |
| None | 1% |
| No response | 86% |
Note: Respondents could provide more than one answer; totals may sum to more than 100%.
Appendix C – Virtual Chairs Survey Results
| % (n=69) |
|
|---|---|
| Female | 32% |
| Male | 68% |
Note: Due to rounding, total may not sum to 100%.
| % (n=69) |
|
|---|---|
| Mid-career scientist (5-15 years as an independent researcher) | 23% |
| Senior scientist (>15 years as an independent researcher) | 71% |
| Knowledge user | 4% |
| Other | 1% |
Note: Respondents could provide more than one answer; totals may sum to more than 100%.
| % (n=69) |
|
|---|---|
| Professor | 67% |
| Researcher | 28% |
| Associate professor | 23% |
| Senior scientist | 20% |
| Clinician | 13% |
| Research administrator | 13% |
| Scientist | 6% |
| Dean of research (includes Vice-Dean, Associate Dean, Associate Chair, etc.) | 6% |
| Professor emerita | 3% |
| Assistant professor | 1% |
| Other | 1% |
Note: Respondents could provide more than one answer; totals may sum to more than 100%.
| % (n=69) |
|
|---|---|
| Biomedical | 65% |
| Clinical | 14% |
| Social, cultural, environmental and population health | 17% |
| Health systems/services | 3% |
Note: Due to rounding, total may not sum to 100%.
| % (n=69) |
|
|---|---|
| Yes | 97% |
| No | 3% |
Note: Due to rounding, total may not sum to 100%.
| % (n=67) |
|
|---|---|
| Yes | 93% |
| No | 7% |
Note: Due to rounding, total may not sum to 100%.
BASE: Those who read the preliminary reviews.
| % (n=67) |
|
|---|---|
| 0% | 7% |
| 10% | 15% |
| 20% | 15% |
| 30% | 18% |
| 40% | 6% |
| 50% | 15% |
| 60% | 10% |
| 70% | 7% |
| 80% | 6% |
Note: Due to rounding, total may not sum to 100%.
BASE: Those who read the preliminary reviews.
| % (n=69) |
|
|---|---|
| Not enough information/detail given to support rating | 51% |
| Delays in receiving the reviews | 17% |
| Poor quality reviews come from inexperienced/non-knowledgeable reviewers | 14% |
| Rating did not match comments | 13% |
| Information from reviews was missing/unavailable | 9% |
| Form did not allow enough space for enough detail for reviewers | 4% |
| Reviewers provided poor reviews/no reviews because they did not like changes to the peer review system | 3% |
| Other | 10% |
| No response | 25% |
Note: Respondents could provide more than one answer; totals may sum to more than 100%.
| % (n=64) |
|
|---|---|
| Strongly agree | 3% |
| Agree | 22% |
| Agree slightly | 20% |
| Neutral | 5% |
| Disagree slightly | 13% |
| Disagree | 28% |
| Strongly disagree | 9% |
Note: Due to rounding, total may not sum to 100%.
Those who answered “Not applicable”
have been removed from the calculations.
| % (n=64) |
|
|---|---|
| Strongly agree | 2% |
| Agree | 14% |
| Agree slightly | 27% |
| Neutral | 8% |
| Disagree slightly | 22% |
| Disagree | 20% |
| Strongly disagree | 8% |
Note: Due to rounding, total may not sum to 100%.
Those who answered “Not applicable”
have been removed from the calculations.
| % (n=64) |
|
|---|---|
| Strongly agree | 5% |
| Agree | 31% |
| Agree slightly | 22% |
| Neutral | 6% |
| Disagree slightly | 13% |
| Disagree | 17% |
| Strongly disagree | 6% |
Note: Due to rounding, total may not sum to 100%.
Those who answered “Not applicable”
have been removed from the calculations.
| % (n=63) |
|
|---|---|
| Strongly agree | 5% |
| Agree | 32% |
| Agree slightly | 16% |
| Neutral | 13% |
| Disagree slightly | 11% |
| Disagree | 18% |
| Strongly disagree | 6% |
Note: Due to rounding, total may not sum to 100%.
Those who answered “Not applicable”
have been removed from the calculations.
| % (n=64) |
|
|---|---|
| Strongly agree | 3% |
| Agree | 23% |
| Agree slightly | 20% |
| Neutral | 9% |
| Disagree slightly | 19% |
| Disagree | 20% |
| Strongly disagree | 5% |
Note: Due to rounding, total may not sum to 100%.
Those who answered “Not applicable”
have been removed from the calculations.
| % (n=65) |
|
|---|---|
| Strongly agree | 22% |
| Agree | 46% |
| Agree slightly | 17% |
| Neutral | 11% |
| Disagree slightly | 3% |
| Disagree | 2% |
Note: Due to rounding, total may not sum to 100%.
Those who answered “Not applicable”
have been removed from the calculations.
| % (n=66) |
|
|---|---|
| Strongly agree | 32% |
| Agree | 41% |
| Agree slightly | 11% |
| Neutral | 9% |
| Disagree slightly | 5% |
| Disagree | 3% |
Note: Due to rounding, total may not sum to 100%.
Those who answered “Not applicable”
have been removed from the calculations.
| % (n=66) |
|
|---|---|
| Strongly agree | 50% |
| Agree | 38% |
| Agree slightly | 3% |
| Neutral | 5% |
| Disagree slightly | 5% |
Note: Due to rounding, total may not sum to 100%.
Those who answered “Not applicable”
have been removed from the calculations.
| % (n=69) |
|
|---|---|
| Generally negative comments about reviewers | 22% |
| Cannot provide ratings for statements because of variability among reviewers | 10% |
| There was a mix of good and poor reviewers | 6% |
| Prefer face-to-face meetings | 6% |
| Generally positive comments about reviewers | 3% |
| Other | 12% |
| No response | 48% |
Note: Respondents could provide more than one answer; totals may sum to more than 100%.
| % (n=69) |
|
|---|---|
| Strongly agree | 84% |
| Agree | 12% |
| Agree slightly | 1% |
| Disagree | 1% |
| Strongly disagree | 1% |
Note: Due to rounding, total may not sum to 100%.
| % (n=69) |
|
|---|---|
| Strongly agree | 62% |
| Agree | 25% |
| Agree slightly | 4% |
| Neutral | 3% |
| Disagree slightly | 1% |
| Disagree | 3% |
| Strongly disagree | 1% |
Note: Due to rounding, total may not sum to 100%.
| % (n=69) |
|
|---|---|
| Strongly agree | 36% |
| Agree | 33% |
| Agree slightly | 12% |
| Neutral | 6% |
| Disagree slightly | 6% |
| Disagree | 3% |
| Strongly disagree | 4% |
Note: Due to rounding, total may not sum to 100%.
| % (n=69) |
|
|---|---|
| Strongly agree | 64% |
| Agree | 23% |
| Agree slightly | 3% |
| Neutral | 7% |
| Disagree slightly | 3% |
Note: Due to rounding, total may not sum to 100%.
| % (n=69) |
|
|---|---|
| Strongly agree | 62% |
| Agree | 30% |
| Agree slightly | 3% |
| Neutral | 1% |
| Disagree slightly | 3% |
Note: Due to rounding, total may not sum to 100%.
| % (n=69) |
|
|---|---|
| Strongly agree | 56% |
| Agree | 30% |
| Agree slightly | 9% |
| Neutral | 4% |
Note: Due to rounding, total may not sum to 100%.
| % (n=69) |
|
|---|---|
| Strongly agree | 51% |
| Agree | 32% |
| Agree slightly | 9% |
| Neutral | 7% |
| Disagree slightly | 1% |
Note: Due to rounding, total may not sum to 100%.
| % (n=69) |
|
|---|---|
| Strongly agree | 54% |
| Agree | 28% |
| Agree slightly | 12% |
| Neutral | 7% |
Note: Due to rounding, total may not sum to 100%.
| % (n=69) |
|
|---|---|
| All are important | 3% |
| Prefer face-to-face meetings | 3% |
| Other | 17% |
| No response | 77% |
Note: Respondents could provide more than one answer; totals may sum to more than 100%.
| % (n=69) |
|
|---|---|
| Reviewers should be knowledgeable/experienced in the area being reviewed | 12% |
| Reviewers need to provide more details/evidence to support ratings | 6% |
| Need ability to have face-to-face meetings | 3% |
| Allow for more space for reviewers to provide comments | 3% |
| Other | 23% |
| No response | 59% |
Note: Respondents could provide more than one answer; totals may sum to more than 100%.
Appendix D – Final Assessment Stage Reviewers Survey Results
| % (n=14) |
|
|---|---|
| Female | 36% |
| Male | 64% |
Note: Due to rounding, total may not sum to 100%.
| % (n=14) |
|
|---|---|
| Mid-career scientist (5-15 years as an independent researcher) | 29% |
| Senior scientist (>15 years as an independent researcher) | 64% |
| Knowledge user | 7% |
Note: Respondents could provide more than one answer; totals may sum to more than 100%.
| % (n=14) |
|
|---|---|
| Professor | 57% |
| Associate professor | 21% |
| Senior scientist | 14% |
| Researcher | 14% |
| Clinician | 7% |
| Research administrator | 7% |
| Professor emerita | 7% |
Note: Respondents could provide more than one answer; totals may sum to more than 100%.
| % (n=14) |
|
|---|---|
| Biomedical | 64% |
| Clinical | 14% |
| Social, cultural, environmental and population health | 14% |
| Health systems/services | 7% |
Note: Due to rounding, total may not sum to 100%.
| % (n=14) |
|
|---|---|
| Disagree | 57% |
| Disagree strongly | 43% |
Note: Due to rounding, total may not sum to 100%.
| % (n=14) |
|
|---|---|
| Disagree slightly | 7% |
| Disagree | 57% |
| Disagree strongly | 36% |
Note: Due to rounding, total may not sum to 100%.
| % (n=14) |
|
|---|---|
| Yes | 93% |
| No | 7% |
Note: Due to rounding, total may not sum to 100%.
| % (n=13) |
|
|---|---|
| Strongly agree | 69% |
| Agree | 15% |
| Agree slightly | 15% |
Note: Due to rounding, total may not sum to 100%.
BASE: FAS reviewers who consulted the grant applications in addition to Stage 1 reviews.
| % (n=14) |
|
|---|---|
| Reviewers did not provide enough detail/information in their review | 57% |
| Reviewers were not knowledgeable in subject area | 36% |
| Many reviews were not submitted/late | 29% |
| Most Stage 1 reviews were of poor quality | 14% |
| Inconsistencies between comments and rating | 14% |
| CIHR should not assign reviewers | 14% |
| Other | 14% |
| No response | 7% |
Note: Respondents could provide more than one answer; totals may sum to more than 100%.
Appendix E – Addendum to the Tables Presenting Level of Agreement Data (Added to the Report on March 31, 2017 by CIHR)
Background
In addition to the work herein, CIHR procured a second contractor [i.e., Knowledge Translation Program – (KTP)] to analyze and report against all of the survey data collected from the 2016 Project Grant competition participants. PRA and KTP presented the data from the Likert type questions gauging participant’s level of agreement with statements concerning review quality in different ways. As such, this addendum was created by CIHR to display the level of agreement data in the same way that was presented in the 2016 Project Grant funding competition Final Report produced by KTP.
Both PRA and KTP analyzed a subset of questions that used a 7-point Likert type scaleFootnote 11 to gauge feedback. However in the PRA report, the seven response choices were combined and presented across three response categoriesFootnote 12. Secondly, the number of respondents per response category was presented for every Likert type question in the KTP report however this was not done in the PRA Report. As such, the amended tables below present the agreement data analyzed in the PRA report in the same format that was presented in the 2016 KTP report.
Important notes regarding this Addendum:
- Changes to the presentation of the agreement data (i.e., displayed in the tables below) were done by CIHR staff using the findings produced and shared by PRA.
- The amended data tables presented below do not appear in the body of this report.
- The data tables below were not part of the report that was shared by CIHR to inform the work of the International Peer Review Expert Panel (PREP).
| Review quality | Survey participant | Strongly Agree | Agree | Agree Slightly | Neutral | Disagree Slightly | Disagree | Strongly Disagree | N/A |
|---|---|---|---|---|---|---|---|---|---|
| Consistent in that the written justifications (strengths and weaknesses) align with the respective ratings. | Applicants after decision (n=1072) | 52 (4.9%) |
166 (15.5%) |
96 (9.0%) |
66 (6.2%) |
108 (10.1%) |
234 (21.8%) |
350 (32.6%) |
|
| Provide information that will be useful in refining my application for a future competition. | Applicants after decision (n=1006) | 33 (3.3%) |
133 (13.2%) | 155 (15.4%) |
76 (7.6%) |
75 (7.5%) |
206 (20.5%) |
328 (32.6%) |
| Adjudication process | Survey participant | Very Satisfied | Satisfied | Slightly Satisfied | Neutral | Slightly Dissatisfied | Dissatisfied | Very Dissatisfied | N/A |
|---|---|---|---|---|---|---|---|---|---|
| Quality of peer review judgments | Applicants after decision (n=1073) | 37 (3.4%) |
105 (9.8%) |
102 (9.5%) |
73 (6.8%) |
137 (12.8%) |
261 (24.3%) |
358 (33.4%) |
|
| Quality of the judgements provided in the Scientific Officer’s notes | Applicants after decision (n=531) | 17 (3.2%) |
61 (11.5%) |
25 (4.7%) |
69 (13.0%) |
35 (6.6%) |
102 (19.2%) |
229 (41.8%) |
| Stage 1 reviewers | Survey participant | Strongly Agree | Agree | Agree Slightly | Neutral | Disagree Slightly | Disagree | Strongly Disagree | N/A |
|---|---|---|---|---|---|---|---|---|---|
| Provided clear feedback to support their ratings.Footnote 14 | FAS reviewers (n=14) | 8 (57.1%) |
6 (42.9%) |
||||||
| Provided sufficient feedback to support their ratings.Footnote 15 | FAS reviewers (n=14) | 1 (7.1%) |
8 (57.1%) |
5 (35.7%) |
| Reading other reviews | Survey participant | Strongly Agree | Agree | Agree Slightly | Neutral | Disagree Slightly | Disagree | Strongly Disagree | N/A |
|---|---|---|---|---|---|---|---|---|---|
| Was helpful. | Stage 1 reviewers (n=724) | 297 (41.0%) |
257 (35.5%) |
84 (11.6%) |
30 (4.1%) |
9 (1.2%) |
8 (1.1%) |
7 (1.0%) |
32 (4.4%) |
| Stage 1 virtual chairs (n=69) | 42 (60.9%) |
17 (24.6%) |
6 (8.7) |
2 (2.9%) |
1 (1.4%) |
1 (1.4%) |
|||
| Influenced my assessment of at least one application (e.g. I considered the other reviewers' comments in my decision-making process). | Stage 1 reviewers (n=724) | 204 (28.2%) |
264 (36.5%) |
86 (11.9%) |
52 (7.2%) |
20 (2.8%) |
45 (6.2%) |
21 (2.9%) |
32 (4.4%) |
| An important component of the Stage 1 review process. | Stage 1 reviewers (n=724) | 349 (48.2%) |
240 (33.1%) |
61 (8.4%) |
35 (4.8%) |
2 (0.3%) |
5 (0.7%) |
8 (1.1%) |
24 (3.3%) |
| Stage 1 virtual chairs (n=69) | 49 (71.0%) |
15 (21.7%) |
1 (1.4%) |
1 (1.4%) |
1 (1.4%) |
2 (2.9%) |
|||
| Reading both the application and Stage 1 reviews was necessary for the Final Assessment Stage. | FAS reviewers (n=14) | 9 (69.2%) |
2 (15.4%) |
2 (15.4%) |
1 (7.1) |
| Importance of preliminary reviewsFootnote 16 | Survey participant | Strongly Agree | Agree | Agree Slightly | Neutral | Disagree Slightly | Disagree | Strongly Disagree | No response |
|---|---|---|---|---|---|---|---|---|---|
| Sufficiently justified strengths and weaknesses | Stage 1 Reviewers (n=717) |
380 (53.0%) |
273 (38.1%) |
36 (5.0%) |
15 (2.1%) |
7 (1.0%) |
3 (0.4%) |
3 (0.4%) |
|
| Stage 1 virtual chairs (n=69) | 58 (84.1%) |
8 (11.6%) |
1 (1.4%) |
1 (1.4%) |
1 (1.4%) |
||||
| Applicants after decision (n=1063) | 567 (53.3%) |
261 (24.6) |
43 (4.0%) |
25 (2.4%) |
23 (2.2) |
58 (5.5%) |
86 (8.1%) |
||
| Appropriate balance of strengths and weaknesses to support ratings | Stage 1 Reviewers (n=717) | 262 (36.5%) |
302 (42.1%) |
55 (7.7%) |
54 (7.5%) |
22 (3.1%) |
14 (2.0%) |
8 (1.1%) |
|
| Stage 1 virtual chairs (n=69) | 43 (62.3%) |
17 (24.6%) |
3 (4.3%) |
2 (2.9%) |
1 (1.4%) |
2 (2.9%) |
1 (1.4%) |
||
| Applicants after decision (n=1057) | 438 (41.4%) |
305 (28.9%) |
71 (6.7%) |
60 (5.7%) |
36 (3.4%) |
53 (5.0%) |
94 (8.9%) |
||
| Adjudication criteria focused comments | Stage 1 Reviewers (n=710) |
224 (31.5%) |
314 (44.2%) |
72 (10.1%) |
59 (8.3%) |
15 (2.1%) |
17 (2.4%) |
9 (1.3%) |
|
| Stage 1 virtual chairs (n=69) | 25 (36.2%) |
23 (33.3%) |
8 (11.6%) |
4 (5.8%) |
4 (5.8%) |
2 (2.9%) |
3 (4.3%) |
||
| Applicants after decision (n=1055) | 325 (30.8%) |
316 (30.0%) |
116 (11.0%) |
89 (8.4%) |
36 (3.4%) |
64 (6.1%) |
108 (10.2%) |
1 (0.1%) |
|
| Absence of factual errors | Stage 1 Reviewers (n=707) |
362 (51.2%) |
277 (39.2%) |
31 (4.4%) |
30 (4.2%) |
1 (0.1%) |
2 (0.3%) |
3 (0.4%) |
1 (0.1%) |
| Stage 1 virtual chairs (n=69) | 44 (63.8%) |
16 (23.2%) |
2 (2.9%) |
5 (7.2%) |
2 (2.9%) |
||||
| Applicants after decision (n=1050) | 576 (54.9%) |
207 (19.7%) |
35 (3.3%) |
77 (7.3%) |
33 (3.1%) |
35 (3.3%) |
87 (8.3%) |
||
| Clear comments | Stage 1 Reviewers (n=718) |
374 (52.1%) |
297 (41.4%) |
22 (3.1%) |
16 (2.2%) |
3 (0.4%) |
2 (0.3%) |
3 (0.4%) |
1 (0.1%) |
| Stage 1 virtual chairs (n=69) | 43 (62.3%) |
21 (30.4%) |
2 (2.9%) |
1 (1.4%) |
2 (2.9%) |
||||
| Applicants after decision (n=1062)) | 527 (49.6%) |
283 (26.6%) |
61 (5.7%) |
45 (4.2%) |
31 (2.9%) |
35 (3.3%) |
80 (7.5%) |
||
| Respectful comments | Stage 1 Reviewers (n=717) |
395 (55.1%) |
267 (37.2%) |
25 (3.5%) |
24 (3.3%) |
2 (0.3%) |
2 (0.3%) |
2 (0.3%) |
|
| Stage 1 virtual chairs (n=69) | 39 (56.5%) |
21 (30.4%) |
6 (8.7%) |
3 (4.3%) |
|||||
| Applicants after decision (n=1059) | 486 (45.9%) |
294 (27.8%) |
90 (8.5%) |
103 (9.7%) |
21 (2.0%) |
21 (2.0%) |
44 (4.2%) |
||
| Absence of inappropriate references to the applicant(s), the research institution(s) or research field | Stage 1 Reviewers (n=709) |
375 (52.9%) |
263 (37.1%) |
26 (3.7%) |
38 (5.4%) |
3 (0.4%) |
2 (0.3%) |
2 (0.3%) |
|
| Stage 1 virtual chairs (n=69) | 35 (50.7%) |
22 (31.9%) |
6 (8.7%) |
5 (7.2% |
1 (1.4%) |
||||
| Applicants after decision (n=1038) | 476 (45.9%) |
276 (26.6%) |
70 (6.7%) |
118 (11.4%) |
25 (2.4%) |
25 (2.4%) |
48 (4.6%) |
||
| No disclosure of personal reviewer information | Stage 1 Reviewers (n=710) |
361 (50.8%) |
247 (34.8%) |
33 (4.6%) |
58 (8.2%) |
2 (0.3%) |
5 (0.7%) |
4 (0.6%) |
|
| Stage 1 virtual chairs (n=69) | 37 (53.6%) |
19 (27.5%) |
8 (11.6%) |
5 (7.2%) |
|||||
| Applicants after decision (n=1016) | 383 (37.7%) |
270 (26.6%) |
59 (5.8%) |
196 (19.3%) |
19 (1.9%) |
24 (2.4%) |
65 (6.4%) |
| Statement applies to reviews you receivedFootnote 17 | Survey participant | Strongly Agree | Agree | Agree Slightly | Neutral | Disagree Slightly | Disagree | Strongly Disagree | No response |
|---|---|---|---|---|---|---|---|---|---|
| Sufficiently justified strengths and weaknesses | Stage 1 reviewers (n=641) | 22 (3.4%) |
277 (43.2%) |
144 (22.5%) |
64 (10.0%) |
67 (10.5%) |
45 (7.0%) |
20 (3.1%) |
2 (0.3%) |
| Stage 1 virtual chairs (n=64) | 2 (3.1%) |
14 (21.9%) |
13 (20.3%) |
3 (4.7%) |
8 (12.5%) |
18 (28.1%) |
6 (9.4%) |
||
| Applicants after decision (n=1055) | 34 (3.2%) |
174 (16.5%) |
152 (14.4%) |
80 (7.6%) |
137 (13.0%) |
222 (21.0% |
255 (24.2%) |
1 (0.1%) |
|
| Appropriate balance of strengths and weaknesses to support ratings | Stage 1 reviewers (n=640) | 22 (3.4) |
232 (36.3%) |
152 (23.8%) |
85 (13.3%) |
74 (11.6%) |
52 (8.1%) |
21 (3.3%) |
2 (0.3%) |
| Stage 1 virtual chairs (n=64) | 1 (1.6%) |
9 (14.1%) |
17 (26.6%) |
5 (7.8%) |
14 (21.9%) |
13 (20.3%) |
5 (7.8%) |
||
| Applicants after decision (n=1053) | 32 (3.0%) |
145 (13.8%) |
122 (11.6%) |
107 (10.2%) |
160 (15.2%) |
214 (20.3%) |
273 (25.9%) |
||
| Adjudication criteria focused comments | Stage 1 reviewers (n=638) | 31 (4.9%) |
249 (39.0%) |
146 (22.9%) |
93 (14.6%) |
55 (8.6%) |
38 (6.0%) |
24 (3.8%) |
2 (0.3%) |
| Stage 1 virtual chairs (n=64) | 3 (4.7%) |
20 (31.3%) |
14 (21.9%) |
4 (6.3%) |
8 (12.5%) |
11 (17.2%) |
4 (6.3%) |
||
| Applicants after decision (n=1048) | 41 (3.9%) |
196 (18.7%) |
133 (12.7%) |
169 (16.1%) |
135 (12.9%) |
178 (17.0%) |
195 (18.6%) |
1 (0.1%) |
|
| Absence of factual errors | Stage 1 reviewers (n=622) | 50 (8.0%) |
271 (43.6%) |
95 (15.3%) |
111 (17.8%) |
51 (8.2%) |
28 (4.5%) |
14 (2.3%) |
2 (0.3%) |
| Stage 1 virtual chairs (n=63) | 3 (4.8%) |
20 (31.7%) |
10 (15.9%) |
8 (12.7%) |
7 (11.1%) |
11 (17.5%) |
4 (6.3%) |
||
| Applicants after decision (n=1026) | 58 (5.7%) |
179 (17.4%) |
91 (8.9%) |
147 (14.3%) |
116 (11.3%) |
162 (15.8%) |
272 (26.5% |
1 (0.1%) |
|
| Clear comments | Stage 1 reviewers (n=640) | 41 (6.4%) |
263 (41.1%) |
143 (22.3%) |
89 (13.9%) |
54 (8.4%) |
31 (4.8%) |
17 (2.7%) |
2 (0.3%) |
| Stage 1 virtual chairs (n=64) | 2 (3.1%) |
15 (23.4%) |
13 (20.3%) |
6 (9.4%) |
12 (18.8%) |
13 (20.3%) |
3 (4.7%) |
||
| Applicants after decision (n=1049) | 52 (5.0%) |
190 (18.1%) |
156 (14.9%) |
185 (17.6%) |
134 (12.8%) |
147 (14.0%) |
185 (17.6%) |
||
| Respectful comments | Stage 1 reviewers (n=640) | 131 (20.5%) |
355 (55.5%) |
80 (12.5%) |
48 (7.5%) |
18 (2.8%) |
4 (0.6%) |
2 (0.3%) |
2 (0.3%) |
| Stage 1 virtual chairs (n=65) | 14 (21.5%) |
30 (46.2%) |
11 (16.9%) |
7 (10.8%) |
2 (3.1%) |
1 (1.5%) |
|||
| Applicants after decision (n=1044) | 162 (15.5) |
360 (34.5%) |
131 (12.5%) |
180 (17.2%) |
52 (5.0%) |
59 (5.7%) |
100 (9.6%) |
||
| Absence of inappropriate references to the applicant(s), the research institution(s) or research field | Stage 1 reviewers (n=629) | 187 (29.7%) |
311 (49.4) |
56 (8.9%) |
52 (8.3%) |
15 (2.4%) |
4 (0.6%) |
2 (0.3%) |
2 (0.3%) |
| Stage 1 virtual chairs (n=66) | 21 (31.8%) |
27 (40.9%) |
7 (10.6%) |
6 (9.1%) |
3 (4.5%) |
2 (3.0%) |
|||
| Applicants after decision (n=1016) | 227 (22.3%) |
346 (34.1%) |
68 (6.7%) |
157 (15.5%) |
51 (5.0%) |
57 (5.6%) |
110 (10.8%) |
||
| No disclosure of personal reviewer information | Stage 1 reviewers (n=620) | 230 (37.1%) |
291 (46.9%) |
32 (5.2%) |
42 (6.8%) |
9 (1.5%) |
8 (1.3%) |
6 (1.0%) |
2 (0.3%) |
| Stage 1 virtual chairs (n=66) | 33 (50.0%) |
25 (37.9%) |
2 (3.0%) |
3 (4.5%) |
3 (4.5%) |
||||
| Applicants after decision (n=964) | 366 (38.0%) |
339 (35.2%) |
53 (5.5%) |
135 (14.0%) |
11 (1.1%) |
16 (1.7%) |
44 (4.6%) |
- Date modified: