Gender Equity Data Analysis – CIHR competition success rates by gender (all CIHR grant programs)
Methods: The data in this section represents the competition results for all of CIHR’s grant programs from 2000/01 to 2015/16. Please note that, unless specified, the data is presented as within-sex success rates to take into account the proportions of applications received from males and females.
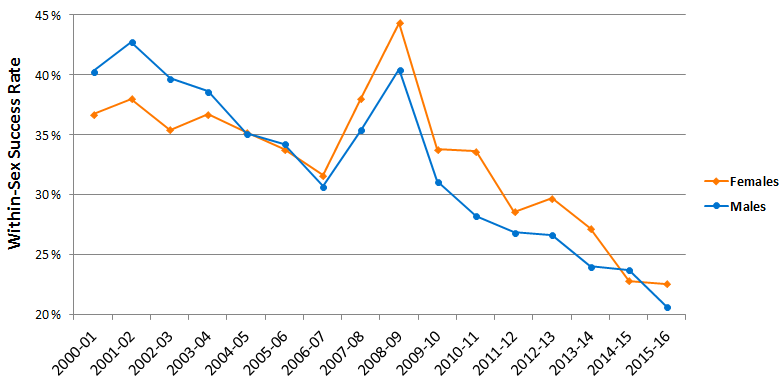
All CIHR grant competitions between 2000/01 to 2015/16
Long description
| 00/01 | 01/02 | 02/03 | 03/04 | 04/05 | 05/06 | 06/07 | 07/08 | 08/09 | 09/10 | 10/11 | 11/12 | 12/13 | 13/14 | 14/15 | 15/16 | ||
|---|---|---|---|---|---|---|---|---|---|---|---|---|---|---|---|---|---|
| Within-sex success rate (%) | M | 40 | 43 | 40 | 39 | 35 | 34 | 31 | 35 | 40 | 31 | 28 | 27 | 27 | 24 | 24 | 21 |
| F | 37 | 38 | 35 | 37 | 35 | 34 | 32 | 38 | 44 | 34 | 34 | 29 | 30 | 27 | 23 | 23 | |
Competition Success Rates by Pillar
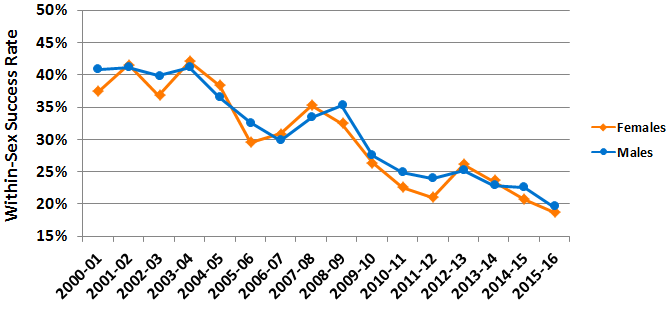
Biomedical Research
Long description
| 00/01 | 01/02 | 02/03 | 03/04 | 04/05 | 05/06 | 06/07 | 07/08 | 08/09 | 09/10 | 10/11 | 11/12 | 12/13 | 13/14 | 14/15 | 15/16 | ||
|---|---|---|---|---|---|---|---|---|---|---|---|---|---|---|---|---|---|
| Within-sex success rate (%) | M | 41 | 41 | 40 | 41 | 36 | 33 | 30 | 34 | 35 | 28 | 25 | 24 | 25 | 23 | 23 | 20 |
| F | 37 | 42 | 37 | 42 | 38 | 29 | 31 | 35 | 32 | 26 | 23 | 21 | 26 | 23 | 21 | 19 | |
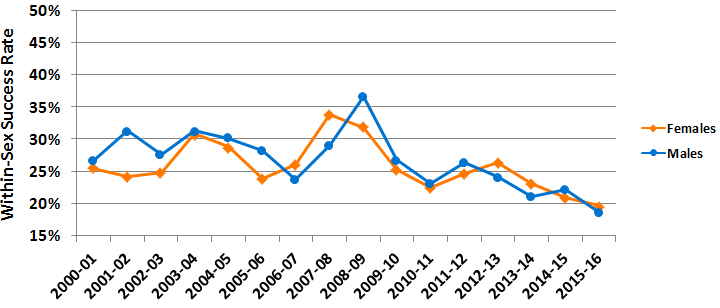
Clinical Research
Long description
| 00/01 | 01/02 | 02/03 | 03/04 | 04/05 | 05/06 | 06/07 | 07/08 | 08/09 | 09/10 | 10/11 | 11/12 | 12/13 | 13/14 | 14/15 | 15/16 | ||
|---|---|---|---|---|---|---|---|---|---|---|---|---|---|---|---|---|---|
| Within-sex success rate (%) | M | 27 | 31 | 28 | 31 | 30 | 28 | 24 | 29 | 37 | 27 | 23 | 26 | 24 | 21 | 22 | 19 |
| F | 26 | 24 | 25 | 31 | 29 | 24 | 26 | 34 | 32 | 25 | 23 | 25 | 26 | 23 | 21 | 20 | |
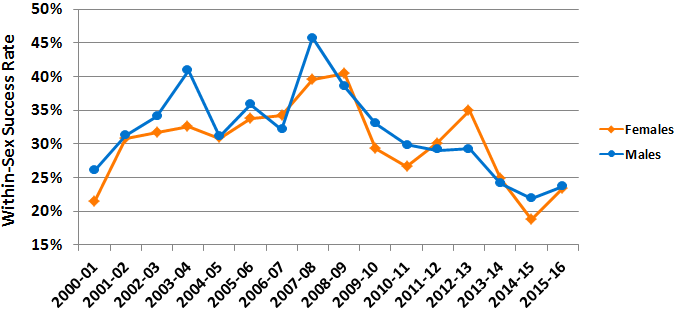
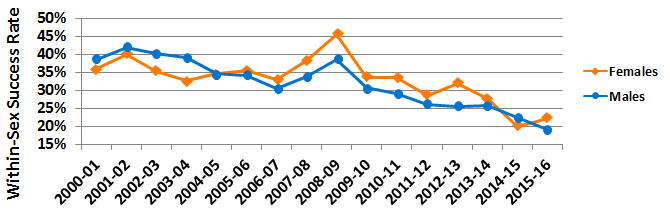
Health Systems and Services Research
Long description
| 00/01 | 01/02 | 02/03 | 03/04 | 04/05 | 05/06 | 06/07 | 07/08 | 08/09 | 09/10 | 10/11 | 11/12 | 12/13 | 13/14 | 14/15 | 15/16 | ||
|---|---|---|---|---|---|---|---|---|---|---|---|---|---|---|---|---|---|
| Within-sex success rate (%) | M | 26 | 31 | 34 | 41 | 31 | 36 | 32 | 46 | 39 | 33 | 30 | 29 | 29 | 24 | 22 | 24 |
| F | 21 | 31 | 32 | 33 | 31 | 34 | 34 | 40 | 41 | 29 | 27 | 30 | 35 | 25 | 19 | 23 | |
Social, Cultural, Environmental, and Population Health Research
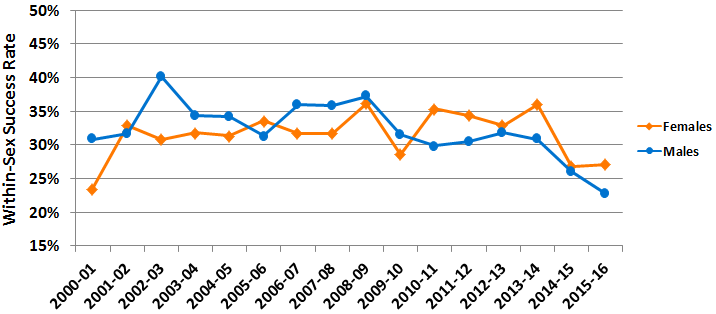
Long description
| 00/01 | 01/02 | 02/03 | 03/04 | 04/05 | 05/06 | 06/07 | 07/08 | 08/09 | 09/10 | 10/11 | 11/12 | 12/13 | 13/14 | 14/15 | 15/16 | ||
|---|---|---|---|---|---|---|---|---|---|---|---|---|---|---|---|---|---|
| Within-sex success rate (%) | M | 31 | 32 | 40 | 34 | 34 | 31 | 36 | 36 | 37 | 32 | 30 | 31 | 31 | 31 | 26 | 23 |
| F | 24 | 33 | 31 | 32 | 31 | 34 | 32 | 32 | 36 | 29 | 35 | 34 | 33 | 36 | 27 | 27 | |
Competition Success Rates by Career Stage
NB: Except for certain competitions, CIHR does not collect information on an applicant’s career stage. In the data below, the applicant’s age was used as an approximate facsimile to career stage.
Early Career Investigators (<35 years)
Long description
| 2000/01 | 2001/02 | 2002/03 | 2003/04 | 2004/05 | 2005/06 | 2006/07 | 2007/08 | 2008/09 | 2009/10 | 2010/11 | 2011/12 | 2012/13 | 2013/14 | 2014/15 | 2015/16 | ||
|---|---|---|---|---|---|---|---|---|---|---|---|---|---|---|---|---|---|
| Within-sex success rate (%) | M | 37 | 37 | 32 | 40 | 32 | 34 | 29 | 32 | 39 | 31 | 29 | 29 | 30 | 24 | 16 | 20 |
| F | 30 | 37 | 35 | 37 | 28 | 33 | 28 | 36 | 45 | 36 | 37 | 30 | 31 | 29 | 20 | 23 | |
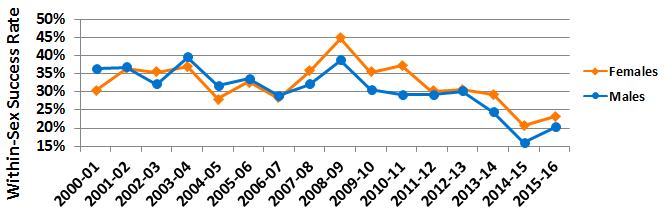
Mid-Career Investigators (36-45 years)
Long description
| 2000/01 | 2001/02 | 2002/03 | 2003/04 | 2004/05 | 2005/06 | 2006/07 | 2007/08 | 2008/09 | 2009/10 | 2010/11 | 2011/12 | 2012/13 | 2013/14 | 2014/15 | 2015/16 | ||
|---|---|---|---|---|---|---|---|---|---|---|---|---|---|---|---|---|---|
| Within-sex success rate (%) | M | 39 | 42 | 40 | 39 | 35 | 30 | 34 | 39 | 31 | 29 | 26 | 26 | 26 | 26 | 22 | 19 |
| F | 36 | 40 | 35 | 33 | 35 | 35 | 33 | 38 | 46 | 34 | 34 | 29 | 32 | 28 | 20 | 22 | |
Mid-Career Investigators (46-55 years)
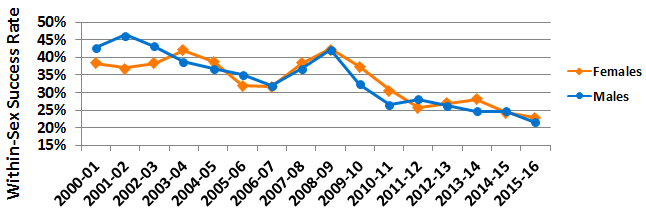
Long description
| 2000/01 | 2001/02 | 2002/03 | 2003/04 | 2004/05 | 2005/06 | 2006/07 | 2007/08 | 2008/09 | 2009/10 | 2010/11 | 2011/12 | 2012/13 | 2013/14 | 2014/15 | 2015/16 | ||
|---|---|---|---|---|---|---|---|---|---|---|---|---|---|---|---|---|---|
| Within-sex success rate (%) | M | 43 | 46 | 43 | 39 | 37 | 35 | 32 | 37 | 42 | 32 | 27 | 28 | 26 | 25 | 25 | 21 |
| F | 38 | 37 | 38 | 42 | 39 | 32 | 32 | 38 | 42 | 37 | 31 | 26 | 27 | 28 | 24 | 23 | |
Senior Investigators (56-65 years)
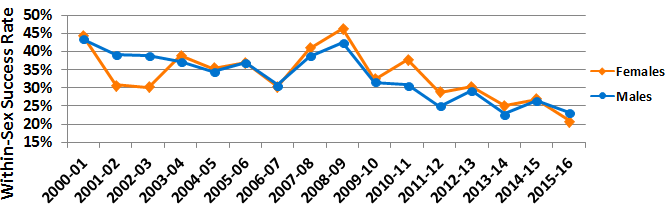
Long description
| 2000/01 | 2001/02 | 2002/03 | 2003/04 | 2004/05 | 2005/06 | 2006/07 | 2007/08 | 2008/09 | 2009/10 | 2010/11 | 2011/12 | 2012/13 | 2013/14 | 2014/15 | 2015/16 | ||
|---|---|---|---|---|---|---|---|---|---|---|---|---|---|---|---|---|---|
| Within-sex success rate (%) | M | 43 | 39 | 39 | 37 | 35 | 37 | 31 | 39 | 43 | 31 | 31 | 25 | 29 | 23 | 27 | 23 |
| F | 44 | 31 | 30 | 39 | 35 | 37 | 30 | 41 | 46 | 32 | 38 | 29 | 30 | 25 | 27 | 21 | |
Senior Investigators (>65 years)
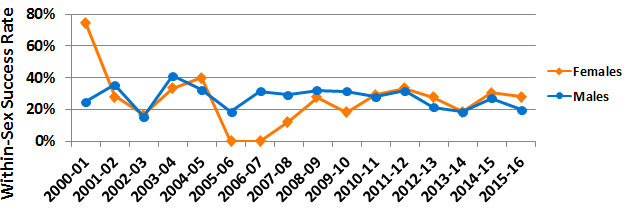
Long description
| 2000/01 | 2001/02 | 2002/03 | 2003/04 | 2004/05 | 2005/06 | 2006/07 | 2007/08 | 2008/09 | 2009/10 | 2010/11 | 2011/12 | 2012/13 | 2013/14 | 2014/15 | 2015/16 | ||
|---|---|---|---|---|---|---|---|---|---|---|---|---|---|---|---|---|---|
| Within-sex success rate (%) | M | 25 | 36 | 16 | 41 | 32 | 19 | 31 | 29 | 32 | 31 | 28 | 32 | 21 | 19 | 27 | 20 |
| F | 75 | 29 | 17 | 33 | 40 | 0 | 0 | 13 | 28 | 18 | 29 | 33 | 28 | 19 | 31 | 28 | |
Note: The n-value is very low for Senior Investigators (>65); therefore, the data should be interpreted with that in mind.
- Date modified: