2016 Project Grant results
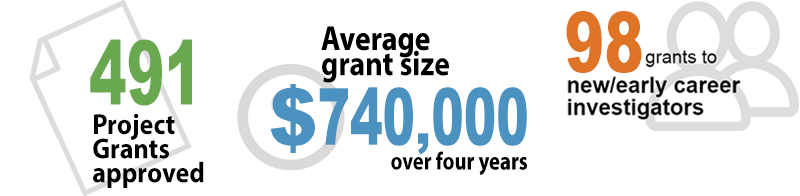
The Project Grant competition has approved 491 research grants, plus an additional 127 bridge grants, for a total investment of approximately $376 millionFootnote 1.
The 491 grants approved were awarded to 468 individual nominated principal investigatorsFootnote 2 (23 NPIs were awarded two grants).
Of the 491 grants, 98 were awarded to new/early career investigators.
The average grant size/duration is approximately $740,000Footnote 3 over four years. The median grant size/duration is approximately $707,000 over five years.
Geographic distribution
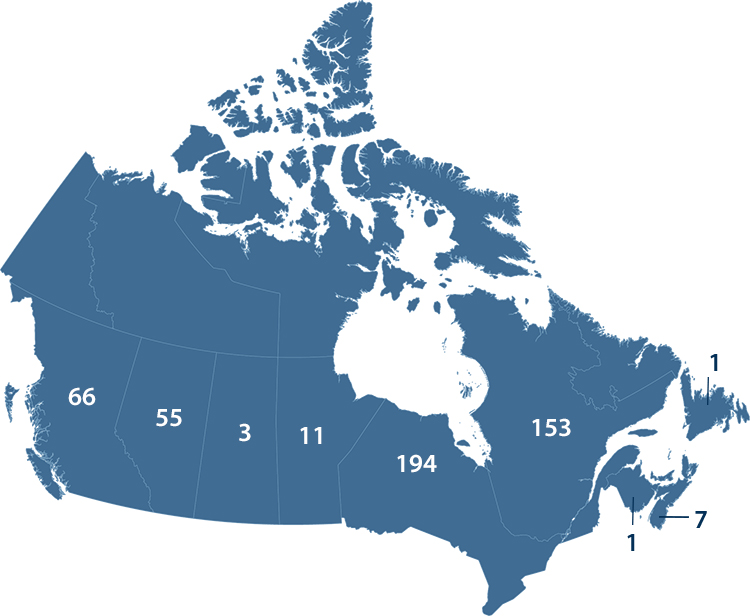
Geographic distribution long description
| Province | Applications submitted | Applications funded |
|---|---|---|
| British Columbia | 416 applications submitted (11%) | 66 applications funded (13%) |
| Alberta | 421 applications submitted (11%) | 55 applications funded (12%) |
| Saskatchewan | 41 applications submitted (1%) | 3 applications funded (1%) |
| Manitoba | 115 applications submitted (3%) | 11 applications funded (2%) |
| Ontario | 1, 458 applications submitted (38%) | 194 applications funded (40%) |
| Quebec | 1,210 applications submitted (32%) | 153 applications funded (31%) |
| New Brunswick | 18 applications submitted (less than 1%) | 1 application funded (less than 1%) |
| Nova Scotia | 109 applications submitted (3%) | 7 applications funded (1%) |
| Prince Edward Island | 2 applications submitted (less than 1%) | 0 application funded |
| Newfoundland and Labrador | 27 applications submitted (1%) | 1 application funded (less than 1%) |
| Total | 3,813 applications submitted | 491 applications funded |
In total, applicants requested over $3.34B in funding to support their ideas.
View full list of Project Grant competition recipients
View full list of bridge grant recipients
Note: Since some of the applications were approved conditionally (based on meeting certain conditions), these specific applications will not appear in the detailed funding decisions database until and unless conditions are met.
Additional details
Breakdown of competition results
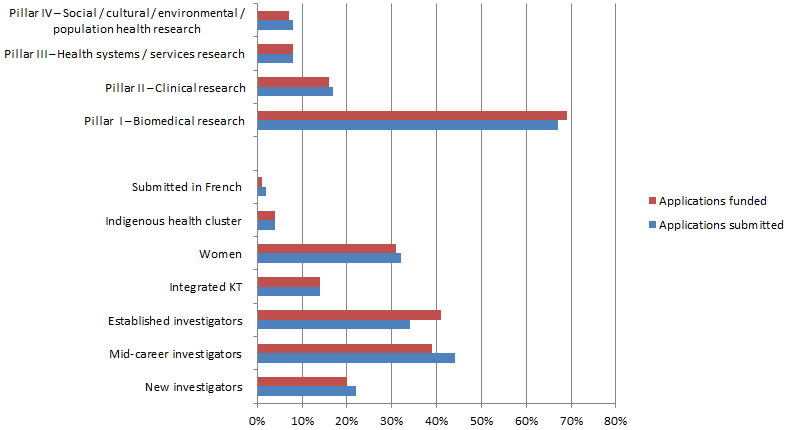
Breakdown of competition results long description
| Application breakdown | Applications submitted | Applications funded |
|---|---|---|
| New investigators | 856 applications submitted (22%) | 98 applications funded (20%) |
| Mid-career investigators | 1,662 applications submitted (44%) | 189 applications funded (39%) |
| Established investigators | 1,283 applications submitted (34%) | 204 applications funded (41%) |
| Integrated KT | 539 applications submitted (14%) | 65 applications funded (14%) |
| Women | 1,228 applications submitted (32%) | 150 applications funded (31%) |
| Indigenous health | 147 applications submitted (4%) | 17 applications funded (4%) |
| Submitted in French | 83 applications submitted (2%) | 6 applications funded (1%) |
| Pillar I – Biomedical research | 2,540 applications submitted (67%) | 345 applications funded (69%) |
| Pillar II – Clinical research | 666 applications submitted (17%) | 75 applications funded (16%) |
| Pillar III – Health systems / services research | 296 applications submitted (8%) | 36 applications funded (8%) |
| Pillar IV – Social / cultural / environmental / population health research | 303 applications submitted (8%) | 35 applications funded (7%) |
New investigators
A specific funding envelope was dedicated to research projects from new/early career investigators, as part of the 2016 Federal Budget investment for investigator-initiated research.
This dedicated funding provided support for an additional 40 research projects from new/early career investigators, bringing the total number of fully funded projects for applicants in this career stage from 58 to 98. In addition, this envelope also provided support for 45 one-year bridge grants.
Large grants awarded
In the Project Grant competition, CIHR limited the number of large grants (defined as being in the top 2% of total grant value) awarded. Limiting the number of large grants helped ensure the support of a greater number of research projects overall.
A total of six large grants were funded using a budget envelope of $25M. An additional 12 large grants were awarded a one-year bridge grant.
Bridge grants
A total of 127 one-year bridge grants were awarded to applications below the funding cut-off. They include:
- 12 fundable large grants (in the top 2% of average annual grant size)
- 45 new/early career investigators
Peer review details
Stage 1
Each application was reviewed by up to five reviewers.
| Applications | Number of reviewers assigned to each |
|---|---|
| 4 (less than 1%) | 1 |
| 48 (1%) | 2 |
| 550 (14%) | 3 |
| 2,390 (63%) | 4 |
| 821 (22%) | 5 |
Applications with only 1 or 2 reviewers were sent directly to the final assessment stage for a full review.
- 1,664 individual reviewers participated in the peer review process.
- Each reviewer received approximately 10 applications.
- The peer-review process resulted in total of 15,405 individual reviews.
Final assessment stage
- The single final assessment stage committee was comprised of 31 virtual chairs from stage 1, including a Chair and a Scientific Officer.
- 100 applications were considered by this committee. They included the highest ranked applications with significant review variances, as well as the under-assigned applications from stage 1.
- After a face-to-face meeting and discussion, the committee recommended an additional 20 applications for full funding.
- Date modified: