Project Grant: Spring 2021 results
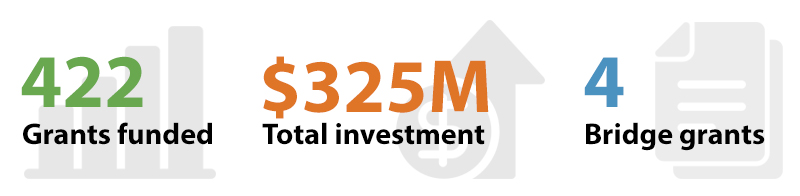
The Project Grants: Spring 2021 competition has approved 422 research grants, plus 4 bridge grants, for a total investment of approximately $325MFootnote 1.
In addition, 59 priority announcement grants were funded for a total amount of $9,815,000 and 11 supplemental prizes were awarded for a total of $555,000.
The 422 grants approved were awarded to 416 individual nominated principal investigators (6 NPIs were awarded two grants). Of the 422 grants, 110 were awarded to early career researchers, and 14 were awarded for Indigenous health research projects.
The average grant size/duration is approximately $770,003 over 4.38 years.
Streamlining
Only a portion of the Project Grant applications submitted to a competition will ultimately be funded. It is therefore important for peer review committee members to focus their discussions on the most competitive applications to ensure an accurate comparative evaluation. To help support this goal, a streamlining process is used to remove applications that will not be funded from the discussion process, thereby allowing committee members more time to judge and discriminate between potentially successful applications.
A total of 1098 applications, representing 46.1% of all submitted applications, were streamlined in this competition. Additional details are provided in the tables below.
| Province | Number of applications submitted | Number of applications streamlined | Percent of applications streamlined | Change from historical (% streamlined) | Number of applications discussed | Percent of applications discussed | Change from historical (% discussed) |
|---|---|---|---|---|---|---|---|
| British Columbia | 296 | 130 | 43.9% | +7.0pp | 166 | 56.1% | -7.0pp |
| Alberta | 255 | 124 | 48.6% | +7.8pp | 131 | 51.4% | -7.8pp |
| Saskatchewan | 36 | 20 | 55.6% | +0.2pp | 16 | 44.4% | -0.2pp |
| Manitoba | 70 | 38 | 54.3% | +9.3pp | 32 | 45.7% | -9.3pp |
| Ontario | 1008 | 468 | 46.4% | +8.9pp | 540 | 53.6% | -8.9pp |
| Québec | 656 | 285 | 43.4% | +5.0pp | 371 | 56.6% | -5.0pp |
| New Brunswick | 4 | 2 | 50.0% | +3.4pp | 2 | 50.0% | -3.4pp |
| Nova Scotia | 42 | 22 | 52.4% | +11.5pp | 20 | 47.6% | -11.5pp |
| Prince Edward Island | 1 | 1 | 100.0% | +33.3pp | 0 | 0.0% | -33.3pp |
| Newfoundland and Labrador | 13 | 8 | 61.5% | +10.3pp | 5 | 38.5% | -10.3pp |
| Total | 2381 | 1098 | 46.1% | +7.4pp | 1283 | 53.9% | -7.4pp |
| Application Breakdown | Number of applications submitted | Number of applications streamlined | Percent of applications streamlined | Change from historical (% streamlined) | Number of applications discussed | Percent of applications discussed | Change from historical (% discussed) |
|---|---|---|---|---|---|---|---|
| Early career researchers (ECRs) | 614 | 297 | 48.4% | +6.8pp | 317 | 51.6% | -6.8pp |
| Mid-career researchers | 896 | 415 | 46.3% | +9.0pp | 481 | 53.7% | -9.0pp |
| Senior researchers | 865 | 385 | 44.5% | +6.1pp | 480 | 55.5% | -6.1pp |
| Knowledge Users | 4 | 0 | 0.0% | -57.4pp | 4 | 100.0% | +57.4pp |
| Unknown career stage | 2 | 1 | 50.0% | -11.9pp | 1 | 50.0% | +11.9pp |
| Integrated KT | 484 | 241 | 49.8% | +13.3pp | 243 | 50.2% | -13.3pp |
| Researchers who identify as female | 867 | 395 | 45.6% | +8.5pp | 472 | 54.4% | -8.5pp |
| Indigenous Health | 28 | 7 | 25.0% | +21.8pp | 21 | 75.0% | -21.8pp |
| Submitted in French | 40 | 23 | 57.5% | +27.7pp | 17 | 42.5% | -27.7pp |
| Biomedical | 1358 | 630 | 46.4% | +3.9pp | 728 | 53.6% | -3.9pp |
| Clinical | 528 | 236 | 44.7% | +8.1pp | 292 | 55.3% | -8.1pp |
| Health systems/services | 239 | 123 | 51.5% | +14.5pp | 116 | 48.5% | -14.5pp |
| Social/Cultural/Environmental/Population Health | 250 | 107 | 42.8% | +6.2pp | 143 | 57.2% | -6.2pp |
Geographic breakdown
| Province | Number of applications submitted | Percent of total applications submitted | Change from historical (% applications) | Number of applications funded | Percent of applications funded | Change from historical (% funded) | Province-specific success rate* | Average grant amount | Median grant amount |
|---|---|---|---|---|---|---|---|---|---|
| British Columbia | 296 | 12.4% | +1.8pp | 59 | 14% | +2.8pp | 19.9% | $775,936 | $761,175 |
| Alberta | 255 | 10.7% | +0.9pp | 45 | 10.7% | +0.3pp | 17.6% | $739,126 | $799,425 |
| Saskatchewan | 36 | 1.5% | +0.0pp | 6 | 1.4% | +0.5pp | 16.7% | $1,006,612 | $1,028,925 |
| Manitoba | 70 | 2.9% | +0.2pp | 15 | 3.6% | +0.4pp | 21.4% | $783,743 | $742,050 |
| Ontario | 1008 | 42.3% | -5.5pp | 170 | 40.3% | -6.5pp | 16.9% | $790,647 | $765,000 |
| Québec | 656 | 27.6% | +3.3pp | 121 | 28.7% | +4.4pp | 18.4% | $739,482 | $761,175 |
| New Brunswick | 4 | 0.2% | -0.1pp | 1 | 0.2% | +0.1pp | 25% | $776,475 | $776,475 |
| Nova Scotia | 42 | 1.8% | -0.5pp | 4 | 0.9% | -1.6pp | 9.5% | $630,742 | $595,935 |
| Prince Edward Island | 1 | 0.0% | +0.0pp | 0 | 0.0% | 0.0pp | 0.0% | $0 | $0 |
| Newfoundland and Labrador | 13 | 0.5% | -0.1pp | 1 | 0.2% | -0.4pp | 7.7% | $918,000 | $918,000 |
| Total | 2381 | 100.0% | 0.0pp | 422 | 100.0% | 0.0pp | 17.7% | $770,003 | $765,000 |
| *The success rate does not include priority announcements or bridge grants. | |||||||||
Note: The applications that were approved conditionally will not appear in the detailed funding decisions database until the conditions have been resolved.
Additional details
| Category | Number of applications submitted | Percent of total applications submitted | Change from historical (% application) | Number of applications funded | Percent of applications funded | Change from historical (% funded) | Category-specific success rate* | Average grant amount | Median grant amount |
|---|---|---|---|---|---|---|---|---|---|
| Early career researchers (ECRs) | 614 | 25.8% | +0.8pp | 110 | 26.1% | -0.5pp | 17.9% | $654,996 | $702,844 |
| Mid-career investigators | 896 | 37.6% | -7.0pp | 157 | 37.2% | -7.6pp | 17.5% | $762,871 | $749,700 |
| Senior investigators | 865 | 36.3% | +6.2pp | 153 | 36.3% | +7.8pp | 17.7% | $863,629 | $849,150 |
| Knowledge Users | 4 | 0.2% | 0.0pp | 1 | 0.2% | +0.0pp | 25% | $110,000 | $110,000 |
| Unknown career stage | 2 | 0.1% | +0.1pp | 1 | 0.2% | +0.2pp | 50% | $875,925 | $875,925 |
| Integrated KT | 484 | 20.3% | -12.8pp | 80 | 19% | -17.6pp | 16.5% | $669,926 | $652,162 |
| Investigators who identify as female | 867 | 36.4% | -5.5pp | 162 | 38.4% | -5.8pp | 18.7% | $730,735 | $721,012 |
| Indigenous Health | 28 | 1.2% | -0.3pp | 14 | 3.3% | -1.7pp | 50% | $1,003,789 | $895,050 |
| Submitted in French | 40 | 1.7% | +0.1pp | 8 | 1.9% | +0.8pp | 20% | $394,559 | $363,375 |
| Biomedical | 1358 | 57% | +22.5pp | 240 | 56.9% | +25.3pp | 17.7% | $860,773 | $864,450 |
| Clinical | 528 | 22.2% | -10.9pp | 91 | 21.6% | -12.1pp | 17.2% | $686,042 | $604,350 |
| Health systems/services | 239 | 10% | -7.9pp | 42 | 10% | -8.2pp | 17.6% | $551,035 | $543,150 |
| Social / Cultural / Environmental / Population Health | 250 | 10.5% | -3.8pp | 48 | 11.4% | -5.0pp | 19.2% | $680,679 | $529,762 |
| *The success rate does not include priority announcements or bridge grants. | |||||||||
Foundation grant holders
Foundation grant holders
This was the first Project Grant competition to which Foundation Grant holders (specifically, grant holders from the 2014 Foundation Grant competition) were eligible to apply. There were 68 applications from Foundation Grant holders coming from 53 unique applicants. There were 15 funded grants awarded to 15 unique Foundation Grant holders.
| Panel | Number of unique Foundation Grant holders awarded grants |
|---|---|
| BCA | 0 |
| BMA | 1 |
| BMB | 1 |
| BME | 0 |
| BS2 | 0 |
| BSA | 0 |
| BSB | 0 |
| BSC | 0 |
| C2 | 0 |
| CA2 | 0 |
| CB1 | 0 |
| CB2 | 0 |
| CBB | 0 |
| CBC | 0 |
| CBT | 2 |
| CD2 | 0 |
| CHI | 0 |
| CIA | 0 |
| CIB | 0 |
| CIC | 0 |
| CID | 0 |
| CMZ | 0 |
| CPT | 0 |
| CSA | 0 |
| CSB | 0 |
| CSC | 0 |
| CT2 | 0 |
| DEV | 0 |
| DOL | 0 |
| E | 0 |
| G | 1 |
| GMX | 0 |
| GSH | 0 |
| HDK | 1 |
| HLE | 0 |
| HPM | 0 |
| HS1 | 0 |
| HS2 | 0 |
| HS3 | 0 |
| IHR | 0 |
| IT | 2 |
| KTR | 0 |
| MCC | 1 |
| MID | 0 |
| MOV | 1 |
| MPI | 0 |
| NSA | 1 |
| NSB | 2 |
| NUT | 0 |
| PB1 | 0 |
| PB2 | 0 |
| PH1 | 0 |
| PH2 | 0 |
| PH3 | 0 |
| PS | 0 |
| PT | 1 |
| RC1 | 0 |
| RC2 | 0 |
| RS | 1 |
| SDA | 0 |
| VVP | 0 |
Foundation grant holder application pressure
Foundation grant holder application pressure
Figure A: Proportion of applications
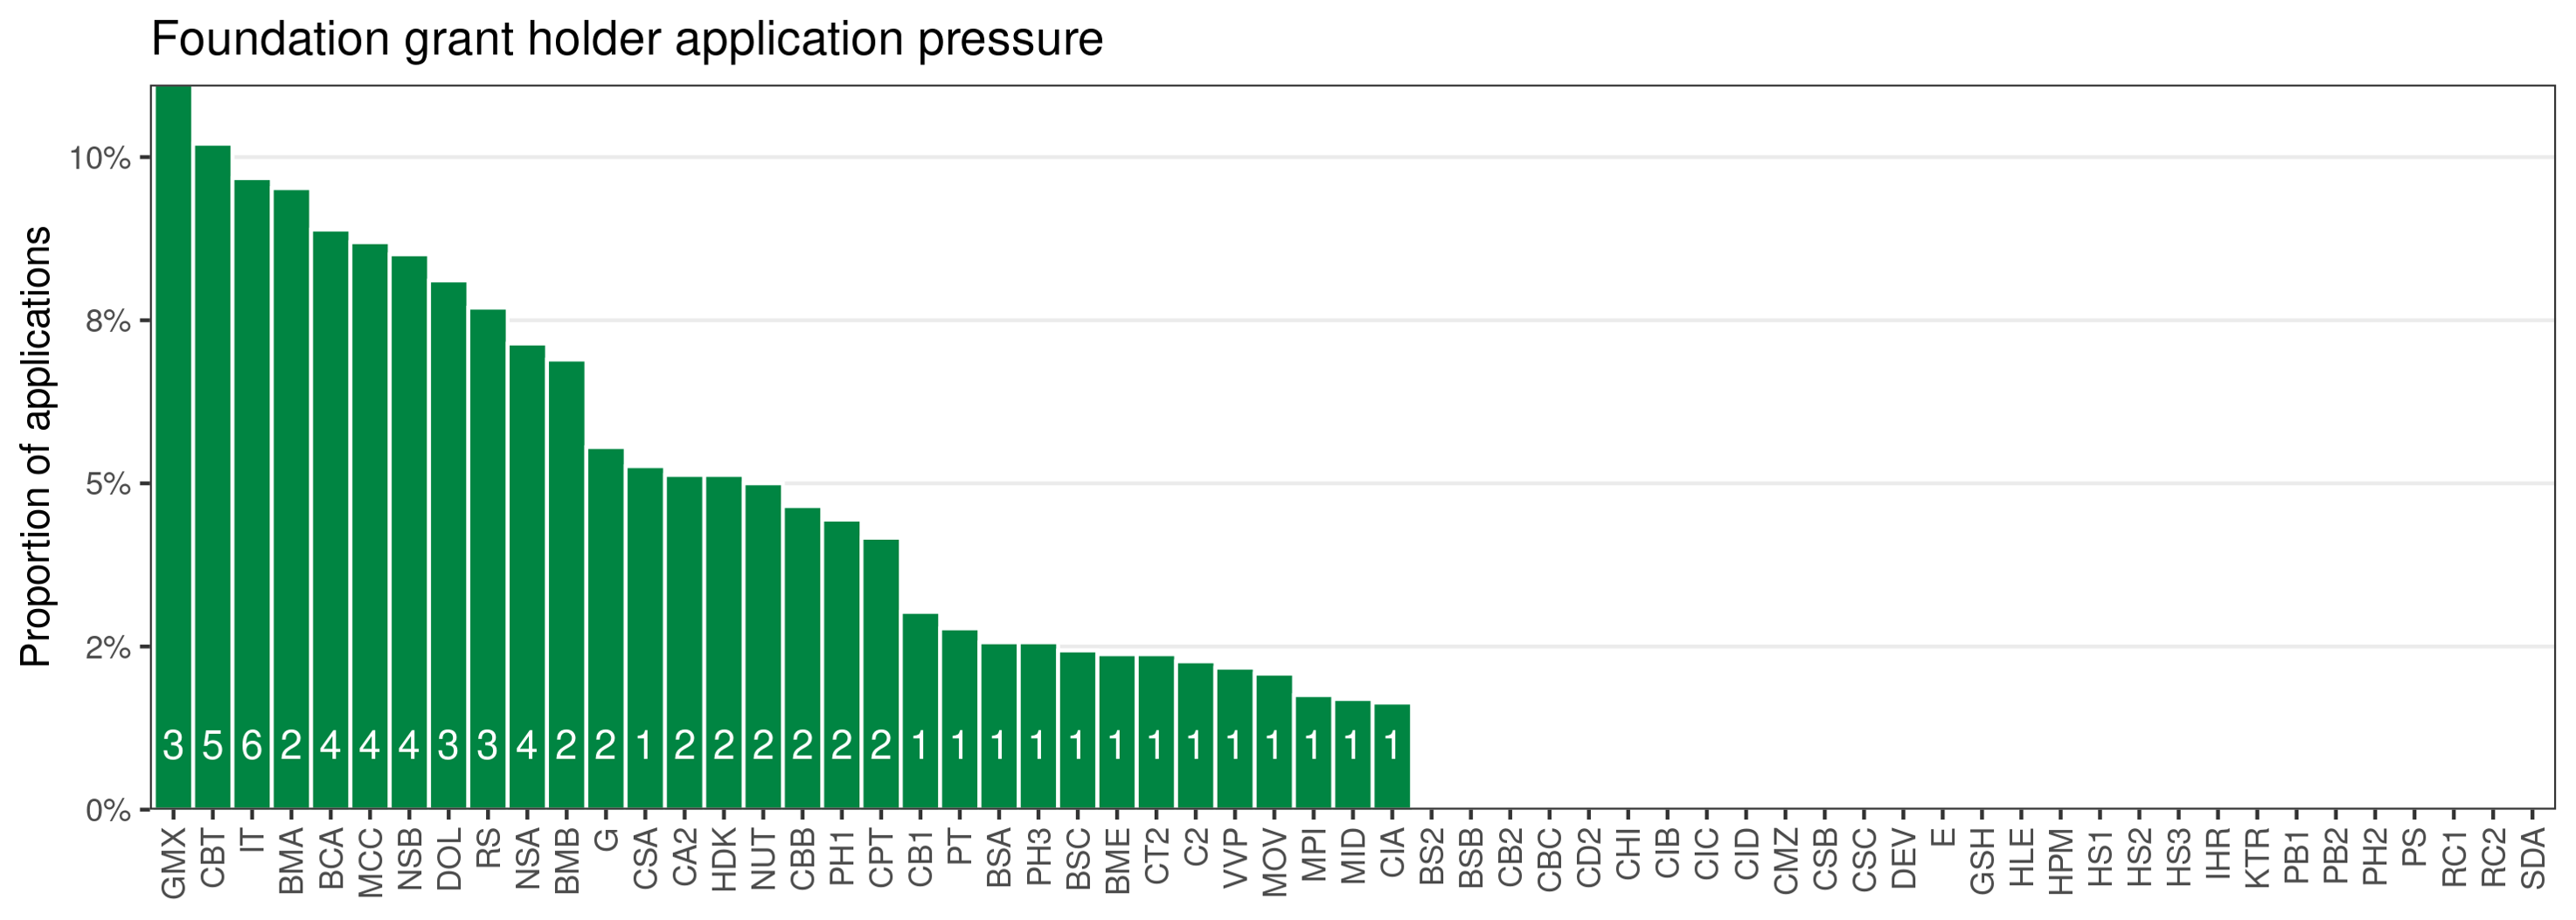
Figure A: Long description
| PRC | Proportion of Foundation applications (%) | Number of Foundation applications |
|---|---|---|
| GMX | 11.1 | 3 |
| CBT | 10.2 | 5 |
| IT | 9.7 | 6 |
| BMA | 9.5 | 2 |
| BCA | 8.9 | 4 |
| MCC | 8.7 | 4 |
| NSB | 8.5 | 4 |
| DOL | 8.1 | 3 |
| RS | 7.7 | 3 |
| NSA | 7.1 | 4 |
| BMB | 6.9 | 2 |
| G | 5.6 | 2 |
| CSA | 5.3 | 1 |
| CA2 | 5.1 | 2 |
| HDK | 5.1 | 2 |
| NUT | 5 | 2 |
| CBB | 4.7 | 2 |
| PH1 | 4.4 | 2 |
| CPT | 4.2 | 2 |
| CB1 | 3 | 1 |
| PT | 2.8 | 1 |
| BSA | 2.6 | 1 |
| PH3 | 2.6 | 1 |
| BSC | 2.4 | 1 |
| BME | 2.4 | 1 |
| CT2 | 2.4 | 1 |
| C2 | 2.3 | 1 |
| VVP | 2.2 | 1 |
| MOV | 2.1 | 1 |
| MPI | 1.8 | 1 |
| MID | 1.7 | 1 |
| CIA | 1.6 | 1 |
| BS2 | 0 | 0 |
| BSB | 0 | 0 |
| CB2 | 0 | 0 |
| CBC | 0 | 0 |
| CD2 | 0 | 0 |
| CHI | 0 | 0 |
| CIB | 0 | 0 |
| CIC | 0 | 0 |
| CID | 0 | 0 |
| CMZ | 0 | 0 |
| CSB | 0 | 0 |
| CSC | 0 | 0 |
| DEV | 0 | 0 |
| E | 0 | 0 |
| GSH | 0 | 0 |
| HLE | 0 | 0 |
| HPM | 0 | 0 |
| HS1 | 0 | 0 |
| HS2 | 0 | 0 |
| HS3 | 0 | 0 |
| IHR | 0 | 0 |
| KTR | 0 | 0 |
| PB1 | 0 | 0 |
| PB2 | 0 | 0 |
| PH2 | 0 | 0 |
| PS | 0 | 0 |
| RC1 | 0 | 0 |
| RC2 | 0 | 0 |
| SDA | 0 | 0 |
Figure B: Proportion of fully funded grants
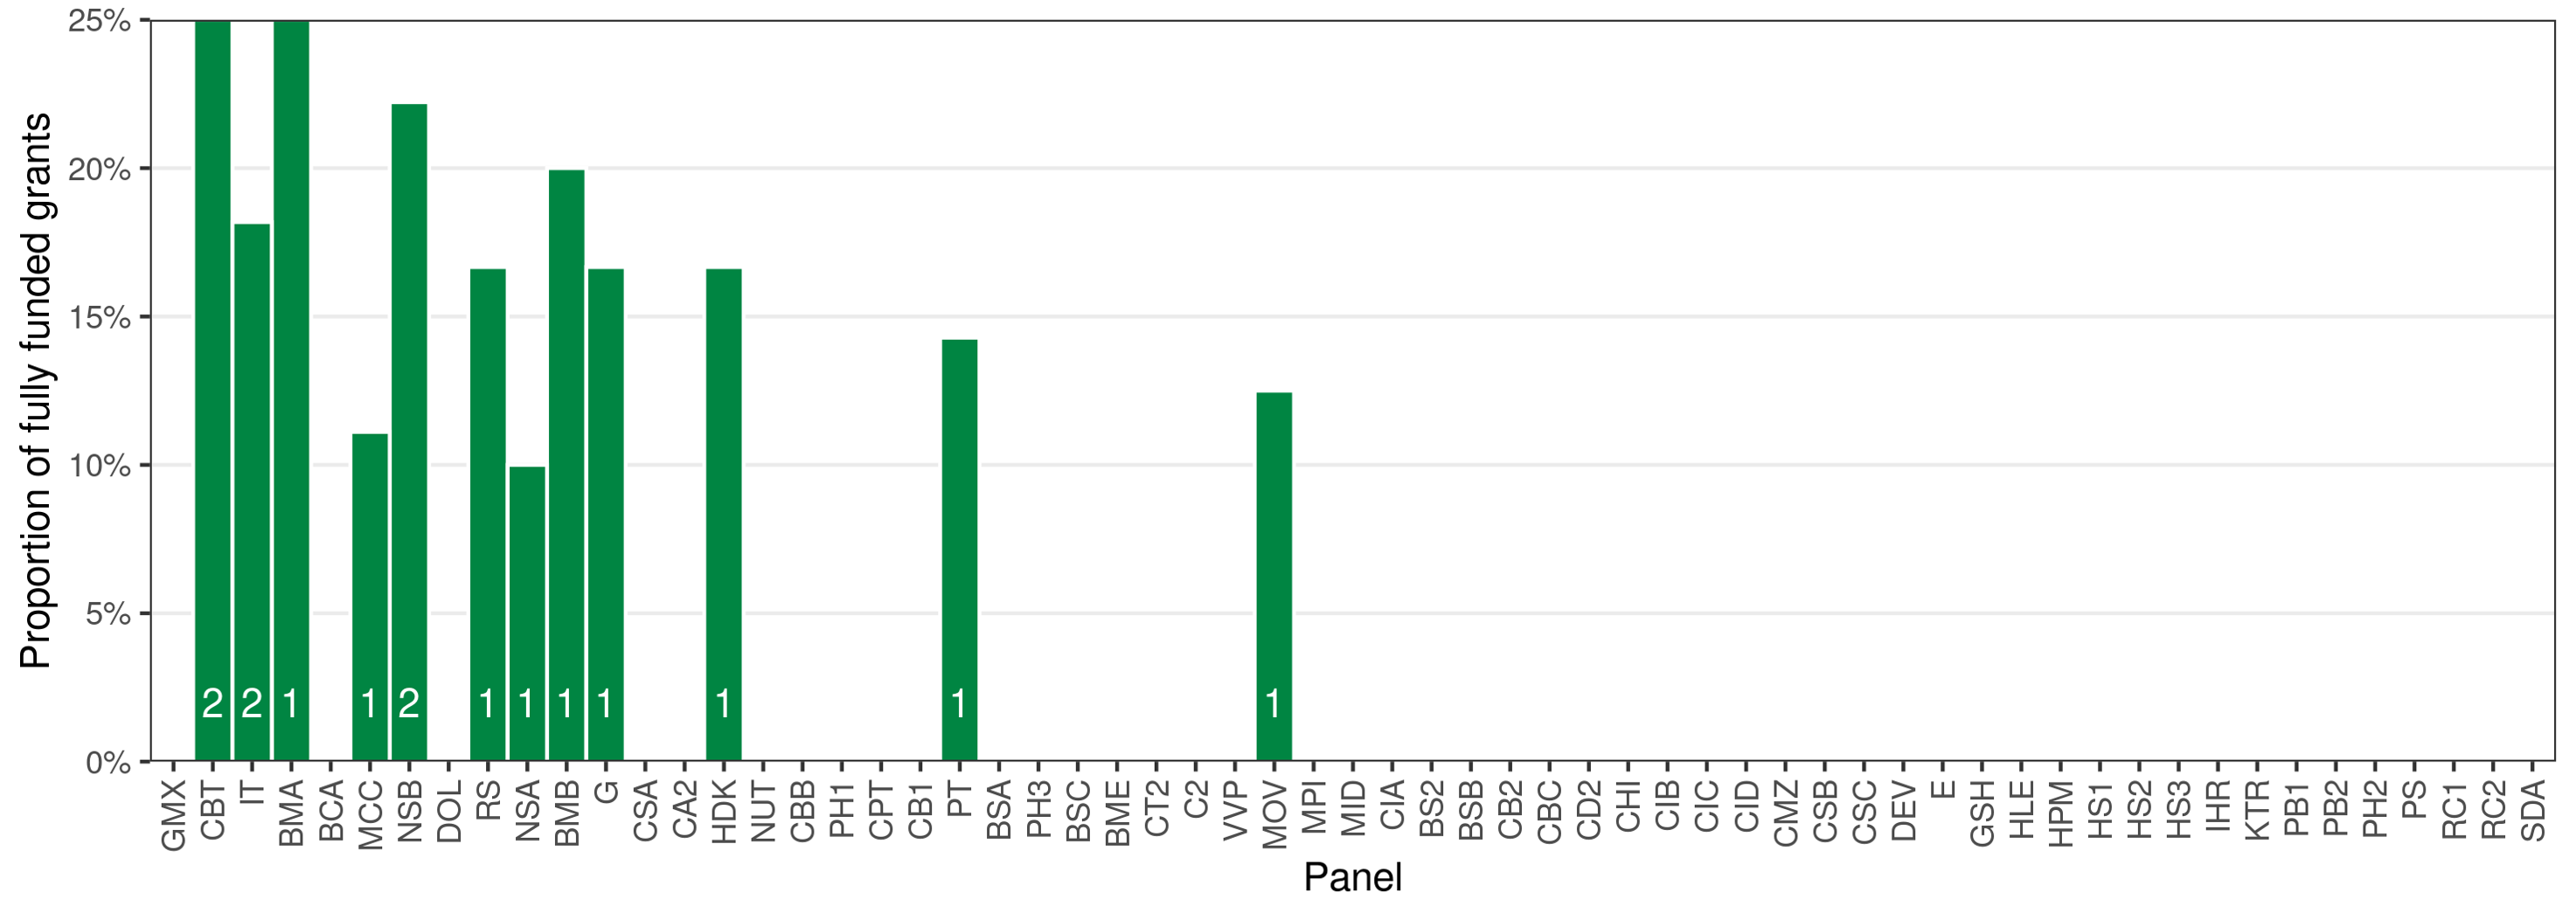
Figure B: Long description
| PRC | Proportion of fully funded Foundation grants (%) | Number of fully funded Foundation grants |
|---|---|---|
| GMX | 0 | 0 |
| CBT | 25 | 2 |
| IT | 18.2 | 2 |
| BMA | 25 | 1 |
| BCA | 0 | 0 |
| MCC | 11.1 | 1 |
| NSB | 22.2 | 2 |
| DOL | 0 | 0 |
| RS | 16.7 | 1 |
| NSA | 10 | 1 |
| BMB | 20 | 1 |
| G | 16.7 | 1 |
| CSA | 0 | 0 |
| CA2 | 0 | 0 |
| HDK | 16.7 | 1 |
| NUT | 0 | 0 |
| CBB | 0 | 0 |
| PH1 | 0 | 0 |
| CPT | 0 | 0 |
| CB1 | 0 | 0 |
| PT | 14.3 | 1 |
| BSA | 0 | 0 |
| PH3 | 0 | 0 |
| BSC | 0 | 0 |
| BME | 0 | 0 |
| CT2 | 0 | 0 |
| C2 | 0 | 0 |
| VVP | 0 | 0 |
| MOV | 12.5 | 1 |
| MPI | 0 | 0 |
| MID | 0 | 0 |
| CIA | 0 | 0 |
| BS2 | 0 | 0 |
| BSB | 0 | 0 |
| CB2 | 0 | 0 |
| CBC | 0 | 0 |
| CD2 | 0 | 0 |
| CHI | 0 | 0 |
| CIB | 0 | 0 |
| CIC | 0 | 0 |
| CID | 0 | 0 |
| CMZ | 0 | 0 |
| CSB | 0 | 0 |
| CSC | 0 | 0 |
| DEV | 0 | 0 |
| E | 0 | 0 |
| GSH | 0 | 0 |
| HLE | 0 | 0 |
| HPM | 0 | 0 |
| HS1 | 0 | 0 |
| HS2 | 0 | 0 |
| HS3 | 0 | 0 |
| IHR | 0 | 0 |
| KTR | 0 | 0 |
| PB1 | 0 | 0 |
| PB2 | 0 | 0 |
| PH2 | 0 | 0 |
| PS | 0 | 0 |
| RC1 | 0 | 0 |
| RC2 | 0 | 0 |
| SDA | 0 | 0 |
Voting behaviour for foundation grantees
Voting behaviour for foundation grantees
i. Preliminary scores
Applications from foundation holders received significantly higher preliminary scores (p < 0.001).
Figure A: Preliminary scores (Histogram)
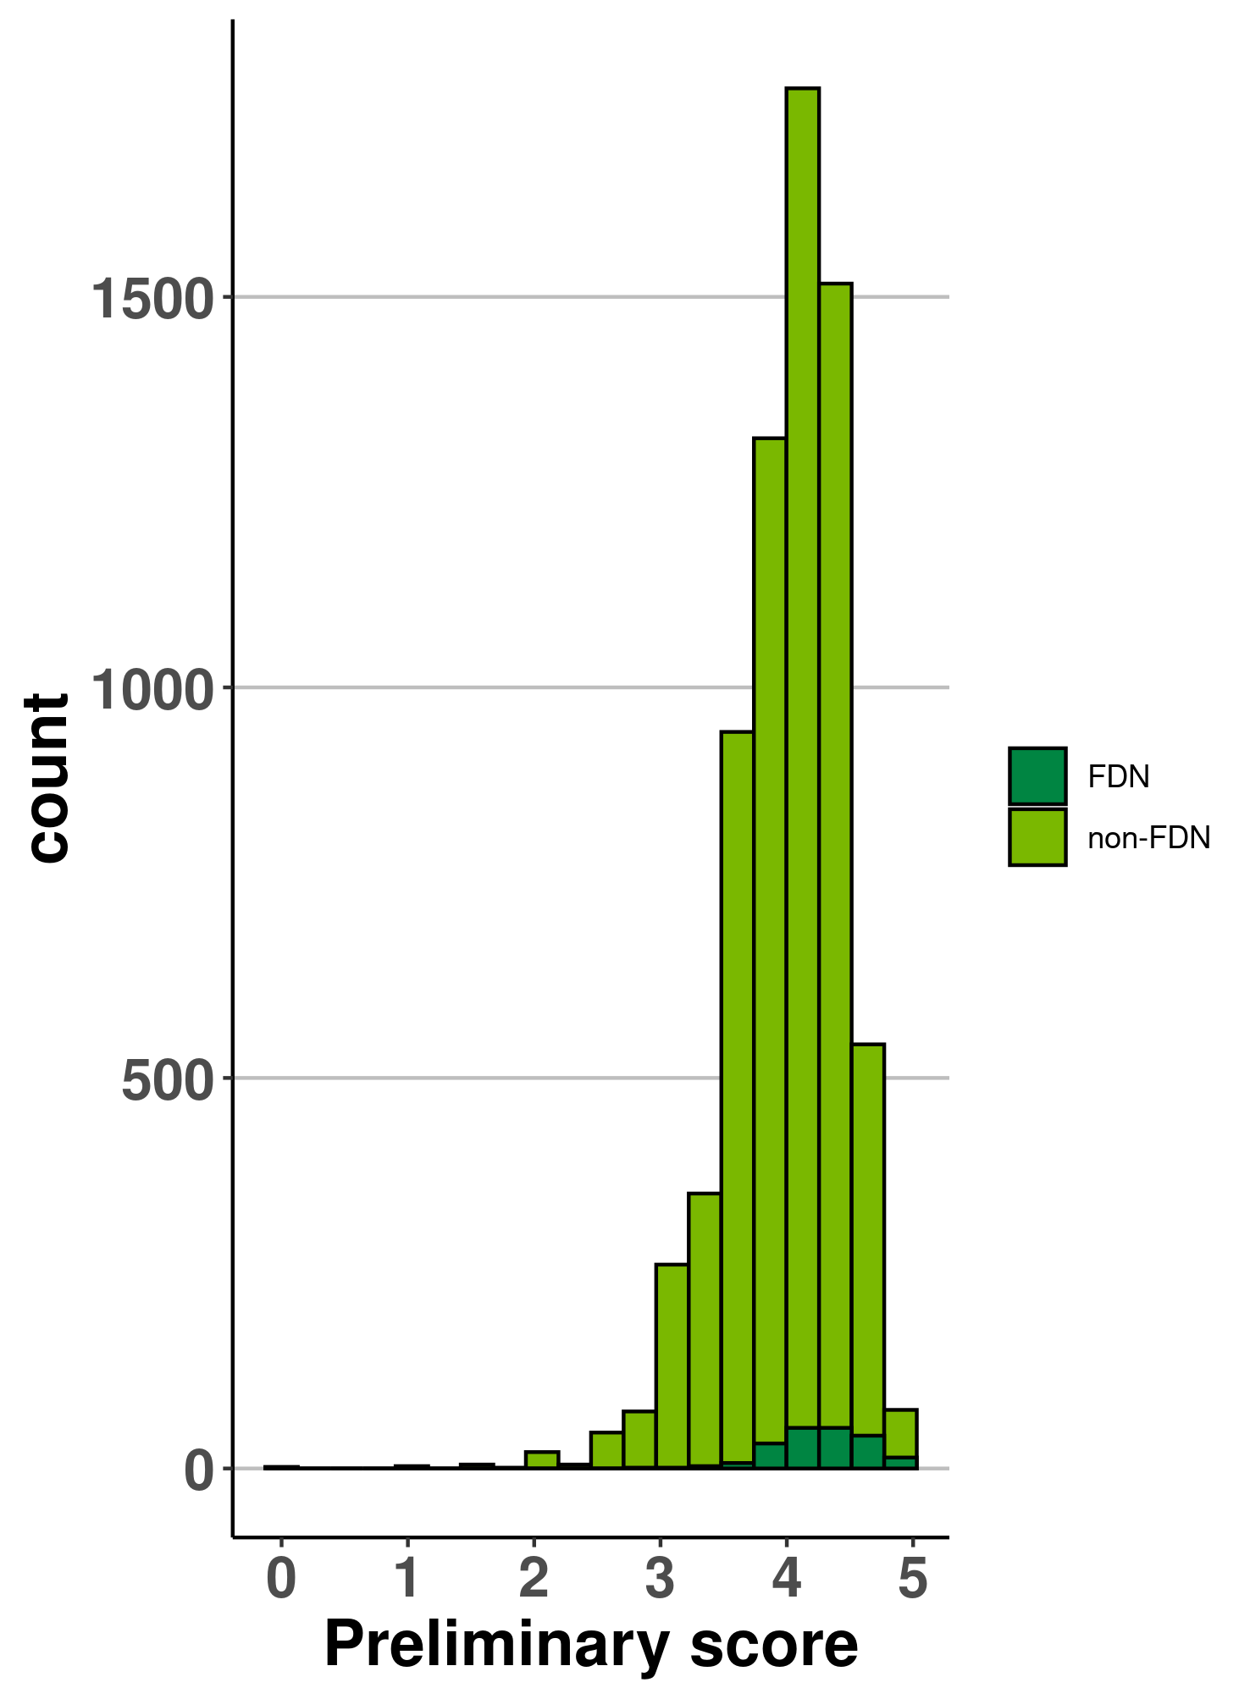
Figure A: Long description
| FDN_holder | bin | count |
|---|---|---|
| non-FDN | 0 | 2 |
| non-FDN | 0.257894736842105 | 0 |
| non-FDN | 0.515789474 | 0 |
| non-FDN | 0.773684211 | 0 |
| non-FDN | 1.031578947 | 3 |
| non-FDN | 1.289473684 | 0 |
| non-FDN | 1.547368421 | 5 |
| non-FDN | 1.805263158 | 1 |
| non-FDN | 2.063157895 | 21 |
| non-FDN | 2.321052632 | 5 |
| non-FDN | 2.578947368 | 46 |
| non-FDN | 2.836842105 | 73 |
| non-FDN | 3.094736842 | 261 |
| non-FDN | 3.352631579 | 352 |
| non-FDN | 3.610526316 | 943 |
| non-FDN | 3.868421053 | 1319 |
| non-FDN | 4.126315789 | 1767 |
| non-FDN | 4.384210526 | 1517 |
| non-FDN | 4.642105263 | 543 |
| non-FDN | 4.9 | 75 |
| FDN | 0 | 0 |
| FDN | 0.257894737 | 0 |
| FDN | 0.515789474 | 0 |
| FDN | 0.773684211 | 0 |
| FDN | 1.031578947 | 0 |
| FDN | 1.289473684 | 0 |
| FDN | 1.547368421 | 0 |
| FDN | 1.805263158 | 0 |
| FDN | 2.063157895 | 0 |
| FDN | 2.321052632 | 0 |
| FDN | 2.578947368 | 0 |
| FDN | 2.836842105 | 1 |
| FDN | 3.094736842 | 1 |
| FDN | 3.352631579 | 3 |
| FDN | 3.610526316 | 7 |
| FDN | 3.868421053 | 32 |
| FDN | 4.126315789 | 52 |
| FDN | 4.384210526 | 52 |
| FDN | 4.642105263 | 42 |
| FDN | 4.9 | 14 |
Figure B: Preliminary scores (B&W)
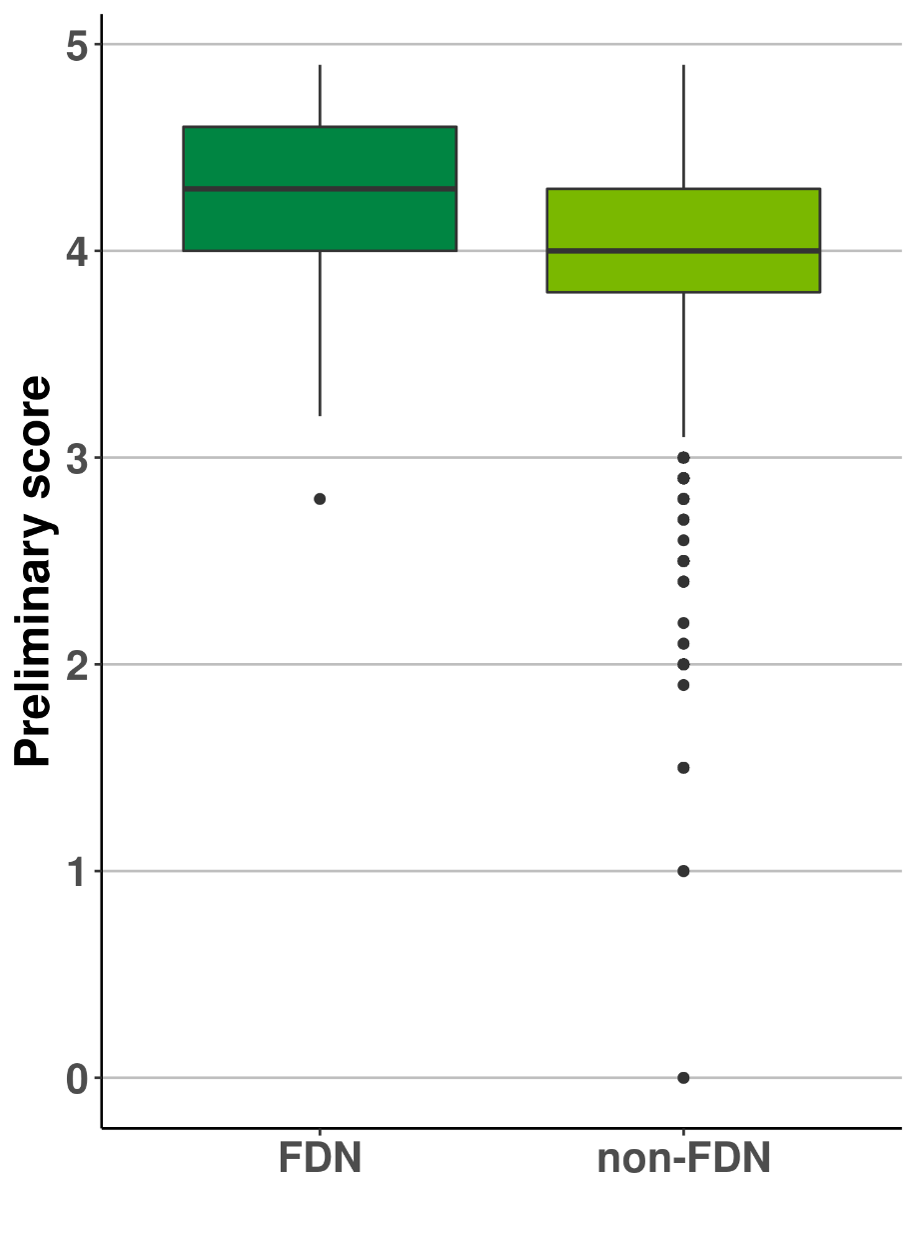
Figure B: Long description
| FDN_holder | median | Q1 | Q3 | min_whisker | max_whisker |
|---|---|---|---|---|---|
| FDN | 4.3 | 4.1 | 4.6 | 3.8 | 4.8 |
| non-FDN | 4.2 | 4 | 4.4 | 3.4 | 4.8 |
ii. Consensus scores
Applications from foundation holders received significantly higher consensus scores (p < 0.001).
Note: Applications that did not receive a consensus score were not included in this analysis.
Figure C: Consensus scores (Histogram)
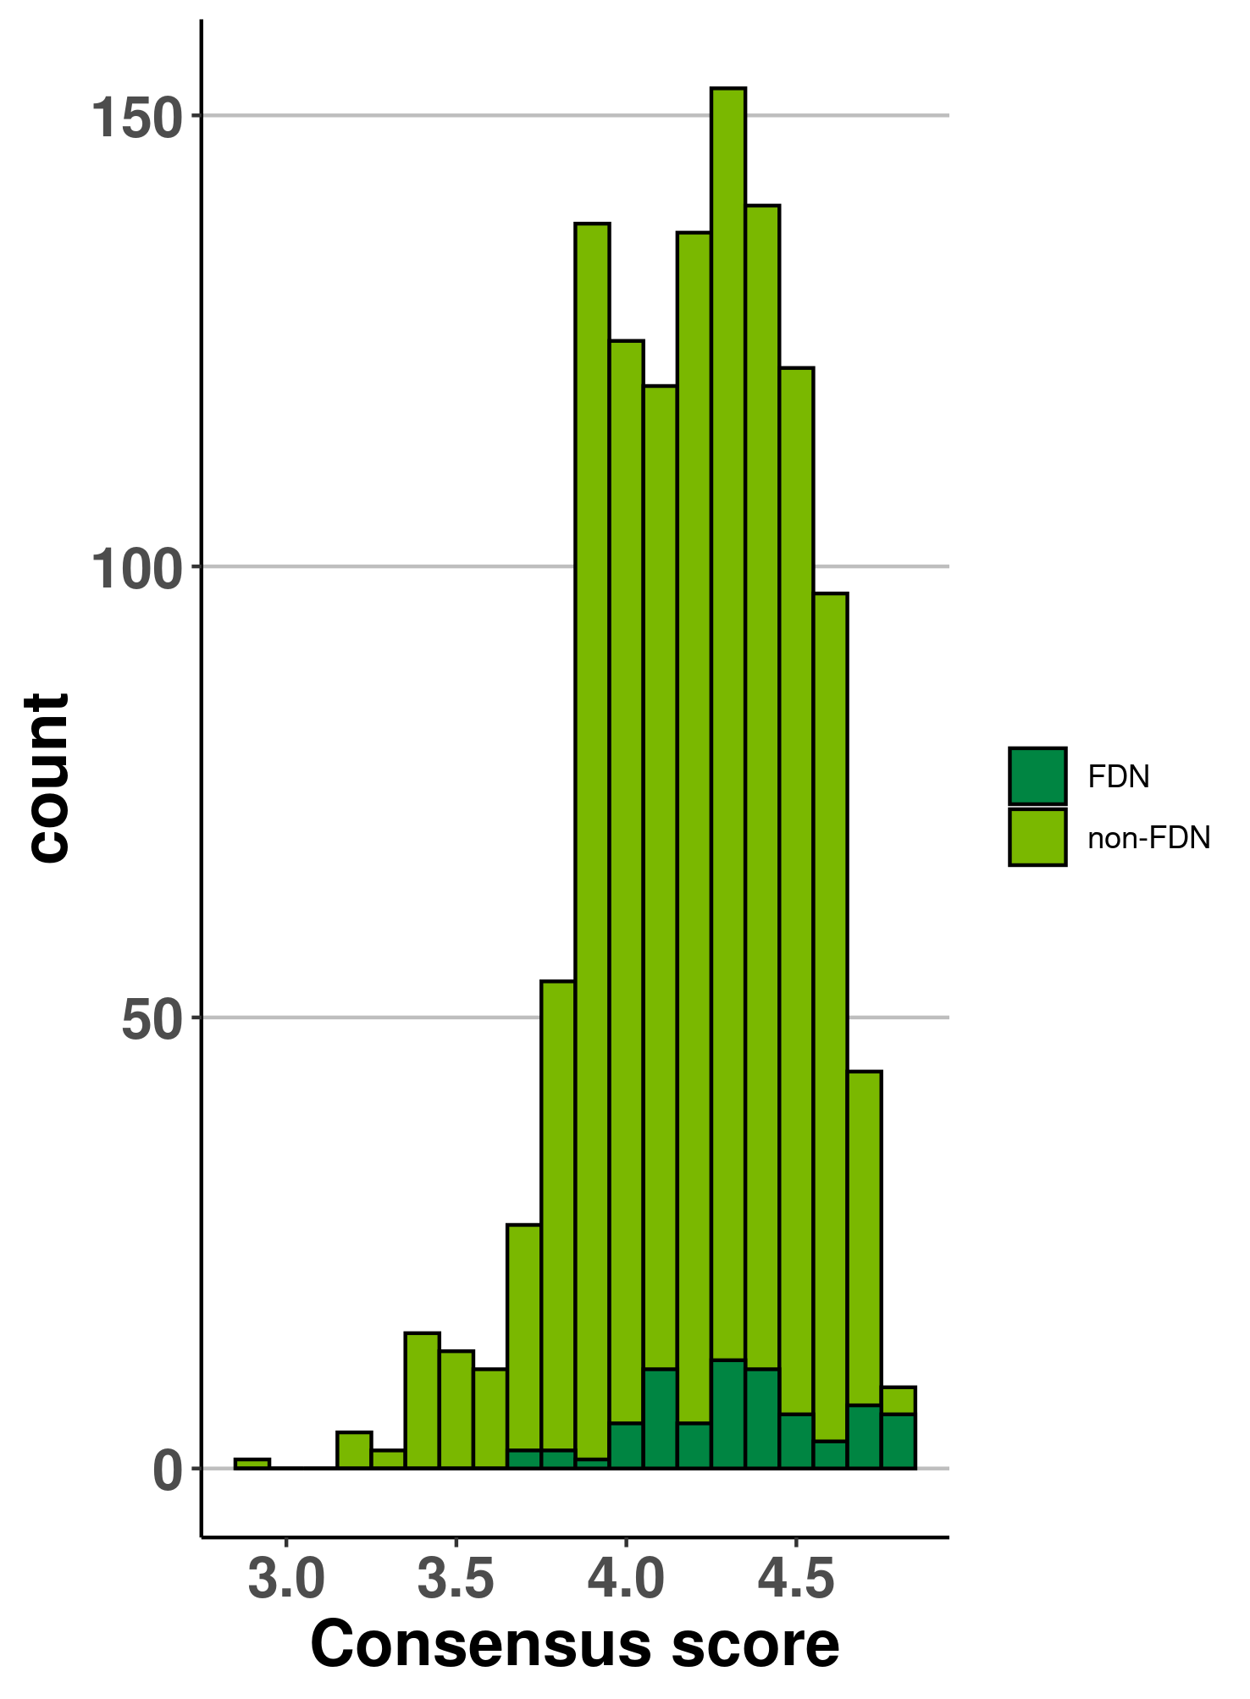
Figure C: Long description
| FDN_holder | bin | count |
|---|---|---|
| non-FDN | 2.9 | 1 |
| non-FDN | 3 | 0 |
| non-FDN | 3.1 | 0 |
| non-FDN | 3.2 | 4 |
| non-FDN | 3.3 | 2 |
| non-FDN | 3.4 | 15 |
| non-FDN | 3.5 | 13 |
| non-FDN | 3.6 | 11 |
| non-FDN | 3.7 | 29 |
| non-FDN | 3.8 | 54 |
| non-FDN | 3.9 | 138 |
| non-FDN | 4 | 127 |
| non-FDN | 4.1 | 122 |
| non-FDN | 4.2 | 140 |
| non-FDN | 4.3 | 156 |
| non-FDN | 4.4 | 144 |
| non-FDN | 4.5 | 125 |
| non-FDN | 4.6 | 98 |
| non-FDN | 4.7 | 45 |
| non-FDN | 4.8 | 10 |
| FDN | 2.9 | 0 |
| FDN | 3 | 0 |
| FDN | 3.1 | 0 |
| FDN | 3.2 | 0 |
| FDN | 3.3 | 0 |
| FDN | 3.4 | 0 |
| FDN | 3.5 | 0 |
| FDN | 3.6 | 0 |
| FDN | 3.7 | 0 |
| FDN | 3.8 | 2 |
| FDN | 3.9 | 1 |
| FDN | 4 | 3 |
| FDN | 4.1 | 9 |
| FDN | 4.2 | 2 |
| FDN | 4.3 | 9 |
| FDN | 4.4 | 7 |
| FDN | 4.5 | 3 |
| FDN | 4.6 | 2 |
| FDN | 4.7 | 6 |
| FDN | 4.8 | 5 |
Figure D: Consensus scores (B&W)
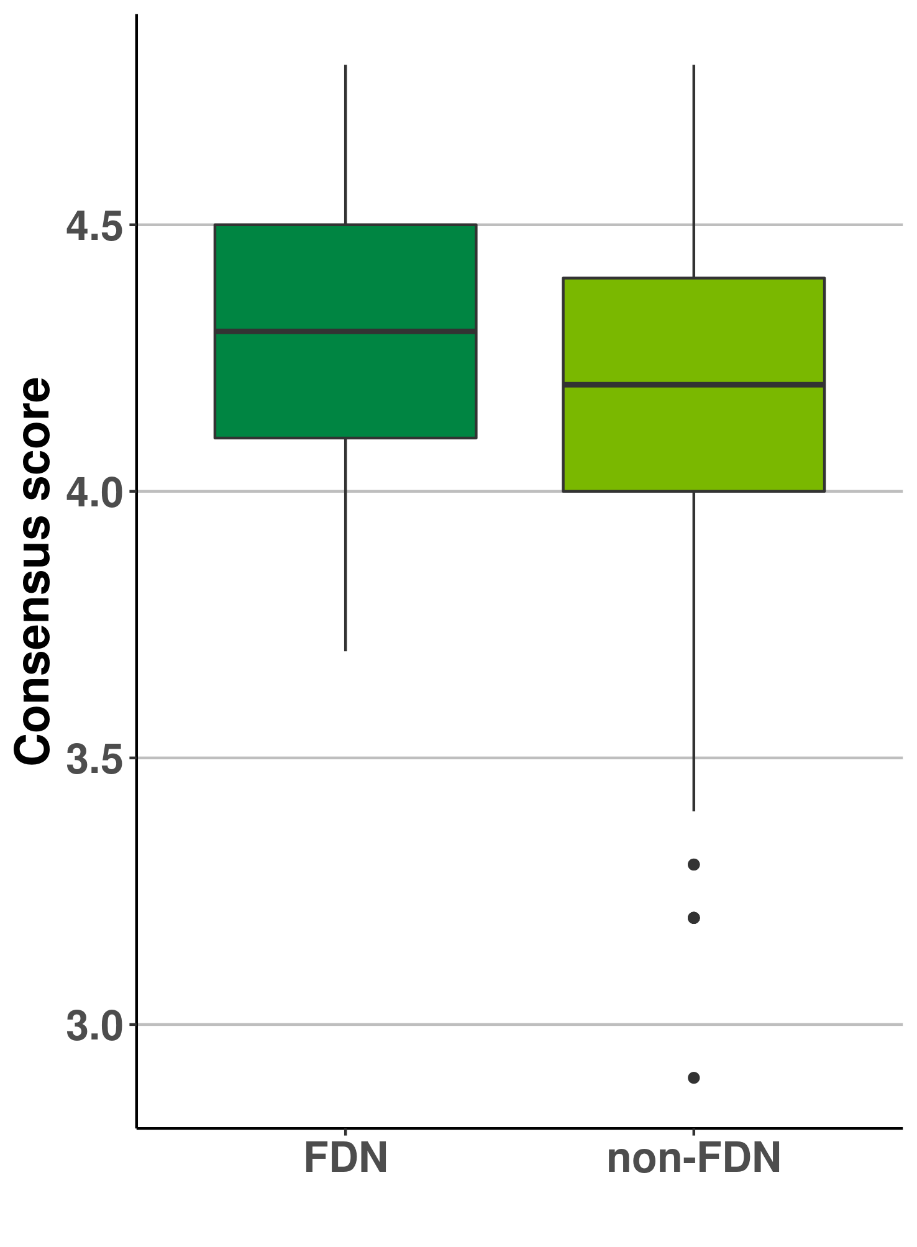
Figure D: Long description
| FDN_holder | median | Q1 | Q3 | min_whisker | max_whisker |
|---|---|---|---|---|---|
| FDN | 4.3 | 4.1 | 4.6 | 3.8 | 4.8 |
| non-FDN | 4.2 | 4 | 4.4 | 3.4 | 4.8 |
iii. Vote: Voted scores
Applications from foundation holders received significantly higher voted scores (p < 0.001).
Figure E: Voted scores (Histogram)
Figure E: Long description
| FDN_holder | bin | count |
|---|---|---|
| non-FDN | 0 | 1 |
| non-FDN | 0.257894737 | 0 |
| non-FDN | 0.515789474 | 0 |
| non-FDN | 0.773684211 | 0 |
| non-FDN | 1.031578947 | 0 |
| non-FDN | 1.289473684 | 0 |
| non-FDN | 1.547368421 | 3 |
| non-FDN | 1.805263158 | 1 |
| non-FDN | 2.063157895 | 19 |
| non-FDN | 2.321052632 | 4 |
| non-FDN | 2.578947368 | 44 |
| non-FDN | 2.836842105 | 101 |
| non-FDN | 3.094736842 | 385 |
| non-FDN | 3.352631579 | 714 |
| non-FDN | 3.610526316 | 2269 |
| non-FDN | 3.868421053 | 3825 |
| non-FDN | 4.126315789 | 6349 |
| non-FDN | 4.384210526 | 5655 |
| non-FDN | 4.642105263 | 2184 |
| non-FDN | 4.9 | 538 |
| FDN | 0 | 0 |
| FDN | 0.257894737 | 0 |
| FDN | 0.515789474 | 0 |
| FDN | 0.773684211 | 0 |
| FDN | 1.031578947 | 0 |
| FDN | 1.289473684 | 0 |
| FDN | 1.547368421 | 0 |
| FDN | 1.805263158 | 0 |
| FDN | 2.063157895 | 0 |
| FDN | 2.321052632 | 0 |
| FDN | 2.578947368 | 0 |
| FDN | 2.836842105 | 1 |
| FDN | 3.094736842 | 1 |
| FDN | 3.352631579 | 10 |
| FDN | 3.610526316 | 23 |
| FDN | 3.868421053 | 89 |
| FDN | 4.126315789 | 271 |
| FDN | 4.384210526 | 229 |
| FDN | 4.642105263 | 125 |
| FDN | 4.9 | 80 |
Figure F: Voted scores (B&W)
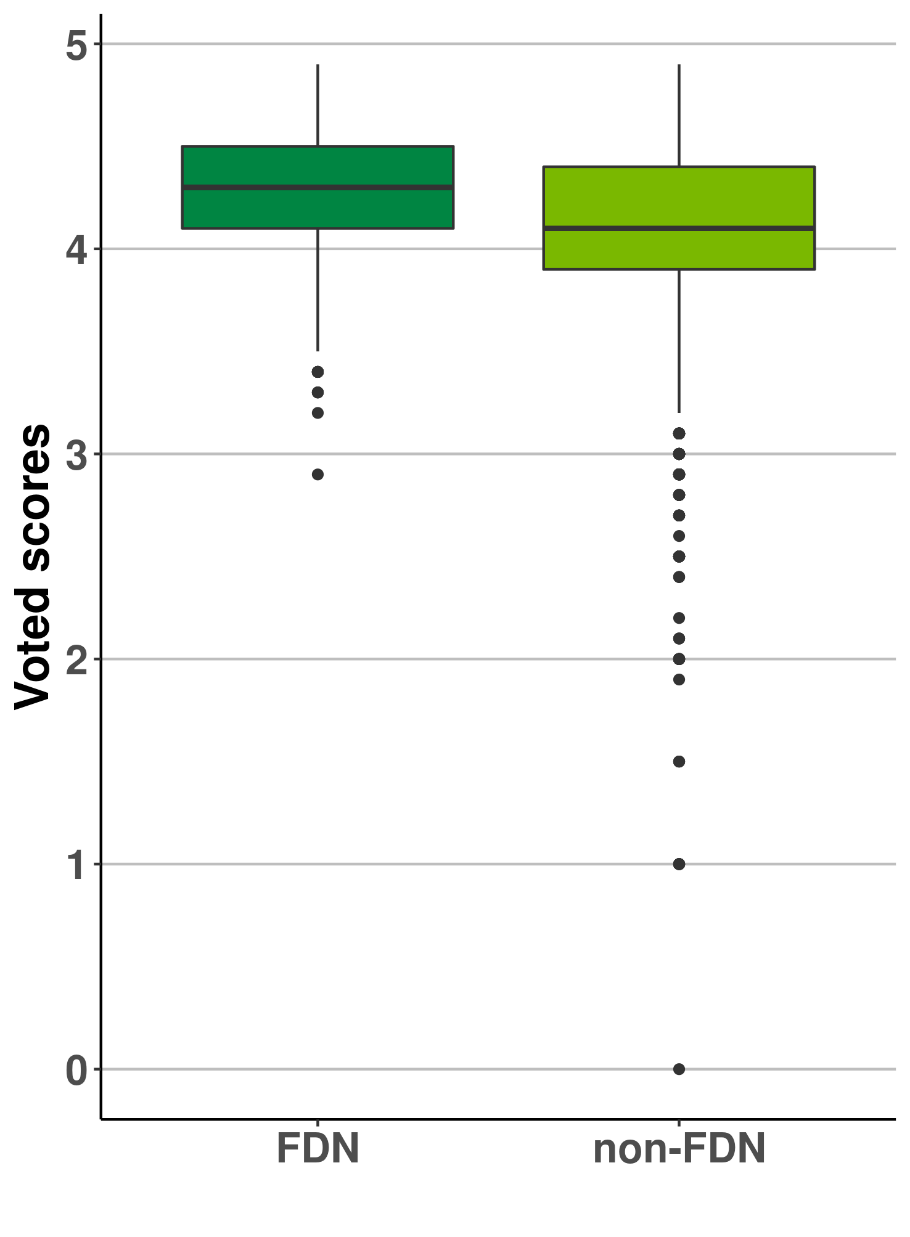
Figure F: Long description
| FDN_holder | median | Q1 | Q3 | min_whisker | max_whisker |
|---|---|---|---|---|---|
| FDN | 4.3 | 4.1 | 4.5 | 3.5 | 4.9 |
| non-FDN | 4.1 | 3.9 | 4.4 | 3.2 | 4.9 |
iii. Vote: Proportion of votes
Applications from foundation holders did not receive a significantly higher proportion of votes (i.e., individual scores > than the consensus.
Note: Applications that did not receive a consensus score were not included in this analysis.
Figure G: Proportion of votes (Histogram)
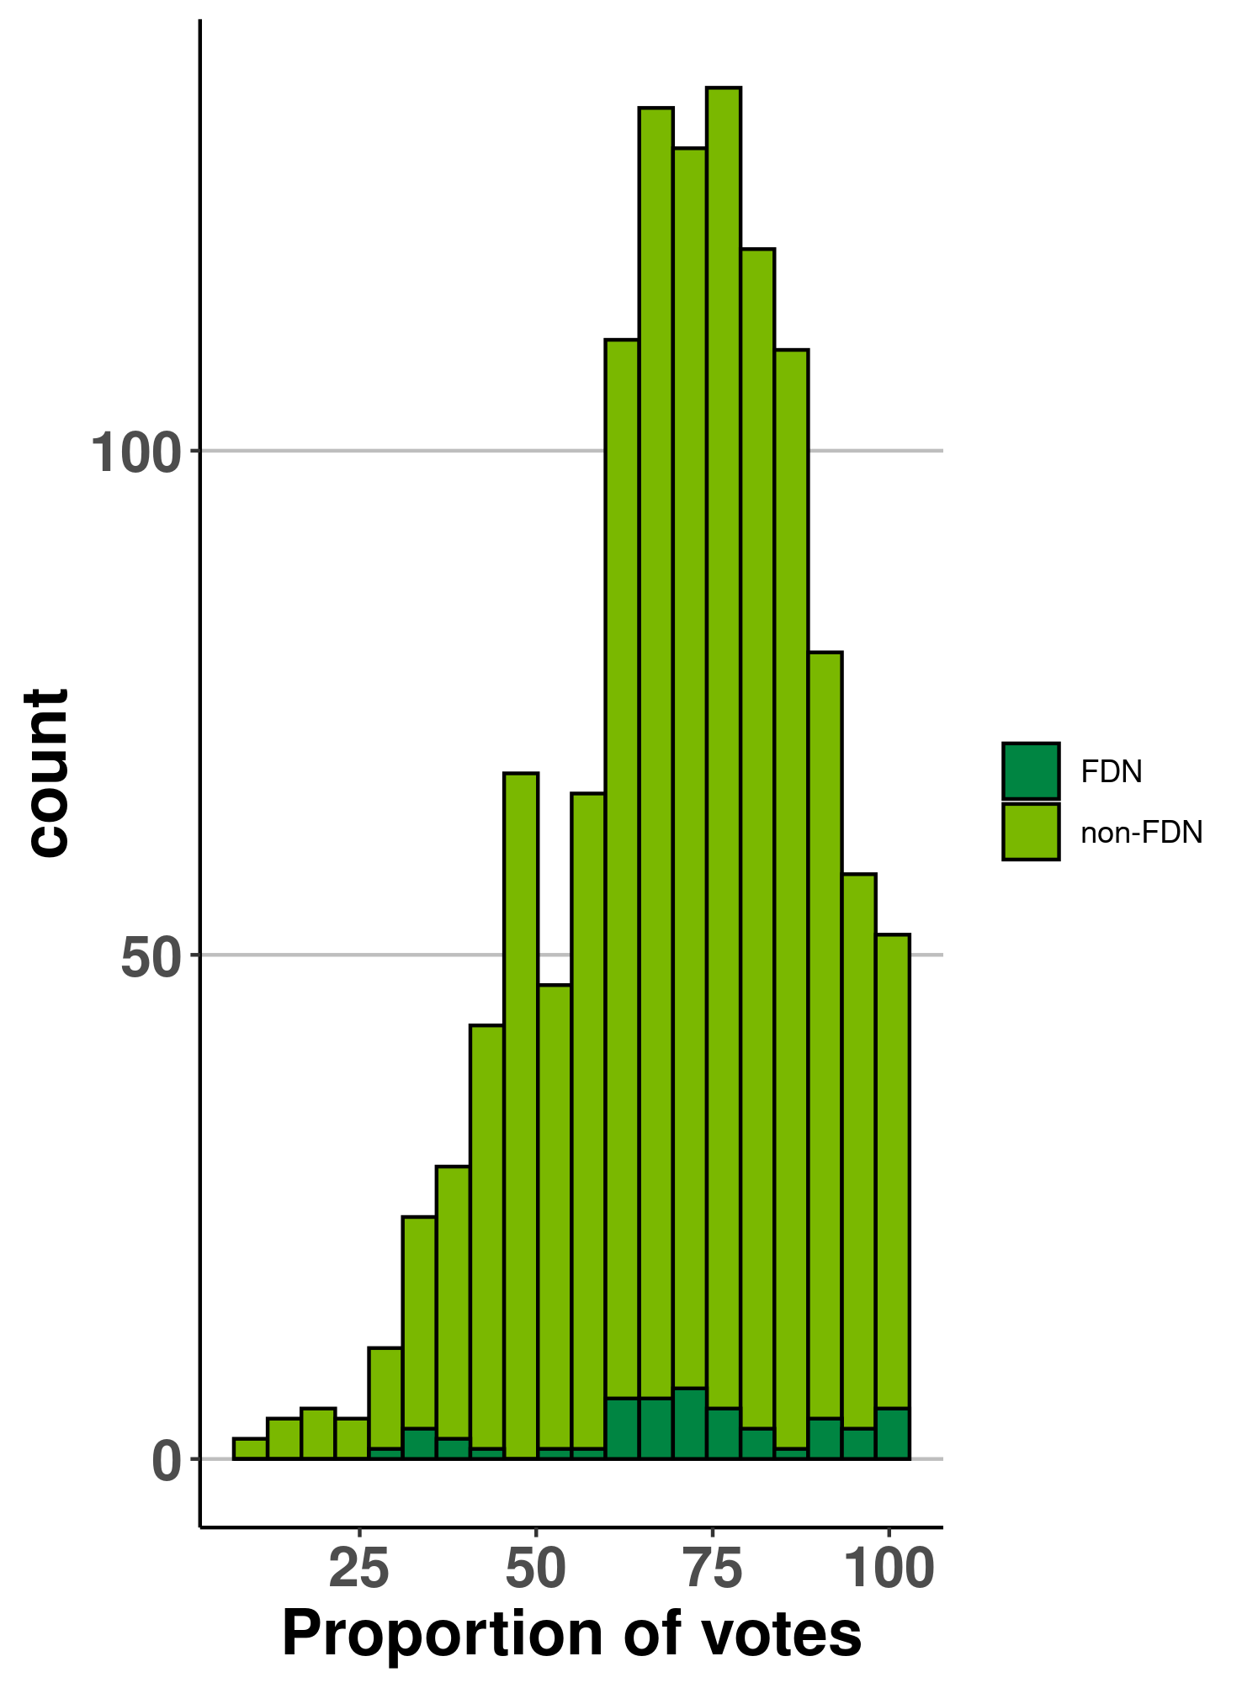
Figure G: Long description
| FDN_holder | bin | count |
|---|---|---|
| non-FDN | 9.56937799 | 2 |
| non-FDN | 14.35406699 | 4 |
| non-FDN | 19.13875598 | 5 |
| non-FDN | 23.92344498 | 4 |
| non-FDN | 28.70813397 | 11 |
| non-FDN | 33.49282297 | 24 |
| non-FDN | 38.27751196 | 29 |
| non-FDN | 43.06220096 | 43 |
| non-FDN | 47.84688995 | 68 |
| non-FDN | 52.63157895 | 47 |
| non-FDN | 57.41626794 | 66 |
| non-FDN | 62.20095694 | 111 |
| non-FDN | 66.98564593 | 134 |
| non-FDN | 71.77033493 | 129 |
| non-FDN | 76.55502392 | 136 |
| non-FDN | 81.33971292 | 121 |
| non-FDN | 86.12440191 | 110 |
| non-FDN | 90.90909091 | 80 |
| non-FDN | 95.6937799 | 58 |
| non-FDN | 100.4784689 | 52 |
| FDN | 9.56937799 | 0 |
| FDN | 14.35406699 | 0 |
| FDN | 19.13875598 | 0 |
| FDN | 23.92344498 | 0 |
| FDN | 28.70813397 | 1 |
| FDN | 33.49282297 | 3 |
| FDN | 38.27751196 | 2 |
| FDN | 43.06220096 | 1 |
| FDN | 47.84688995 | 0 |
| FDN | 52.63157895 | 1 |
| FDN | 57.41626794 | 1 |
| FDN | 62.20095694 | 6 |
| FDN | 66.98564593 | 6 |
| FDN | 71.77033493 | 7 |
| FDN | 76.55502392 | 5 |
| FDN | 81.33971292 | 3 |
| FDN | 86.12440191 | 1 |
| FDN | 90.90909091 | 4 |
| FDN | 95.6937799 | 3 |
| FDN | 100.4784689 | 5 |
Figure H: Proportion of votes (B&W)
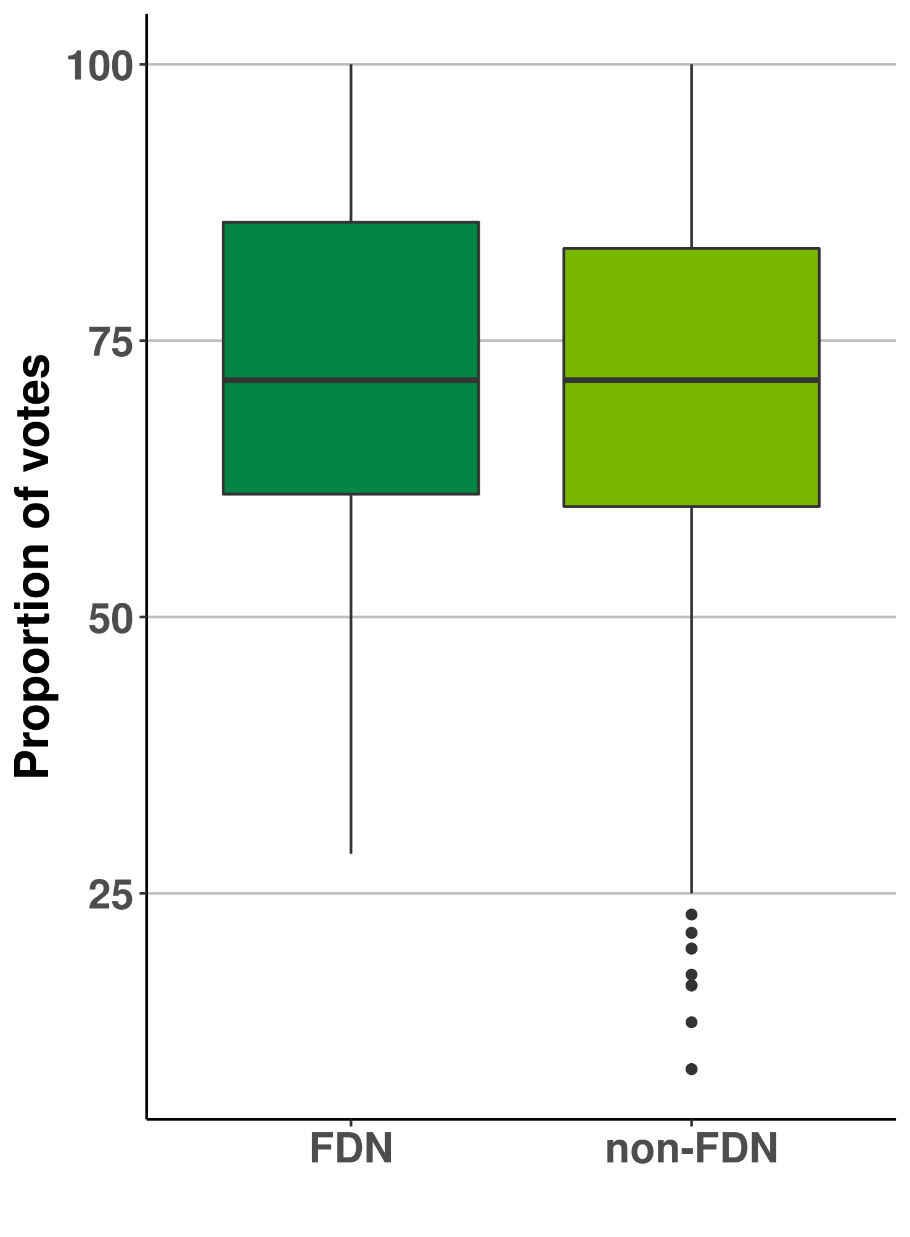
Figure H: Long description
| FDN_holder | median | Q1 | Q3 | min_whisker | max_whisker |
|---|---|---|---|---|---|
| FDN | 71.42857143 | 61.11111111 | 85.71428571 | 28.57142857 | 100 |
| non-FDN | 71.42857143 | 60 | 83.33333333 | 25 | 100 |
iii. Vote: Difference from consensus score
The difference between the consensus and voted scores was not different for applications from foundation holders (p > 0.05).
Note: Applications that did not receive a consensus score were not included in this analysis.
Figure I: Difference from consensus score (Histogram)
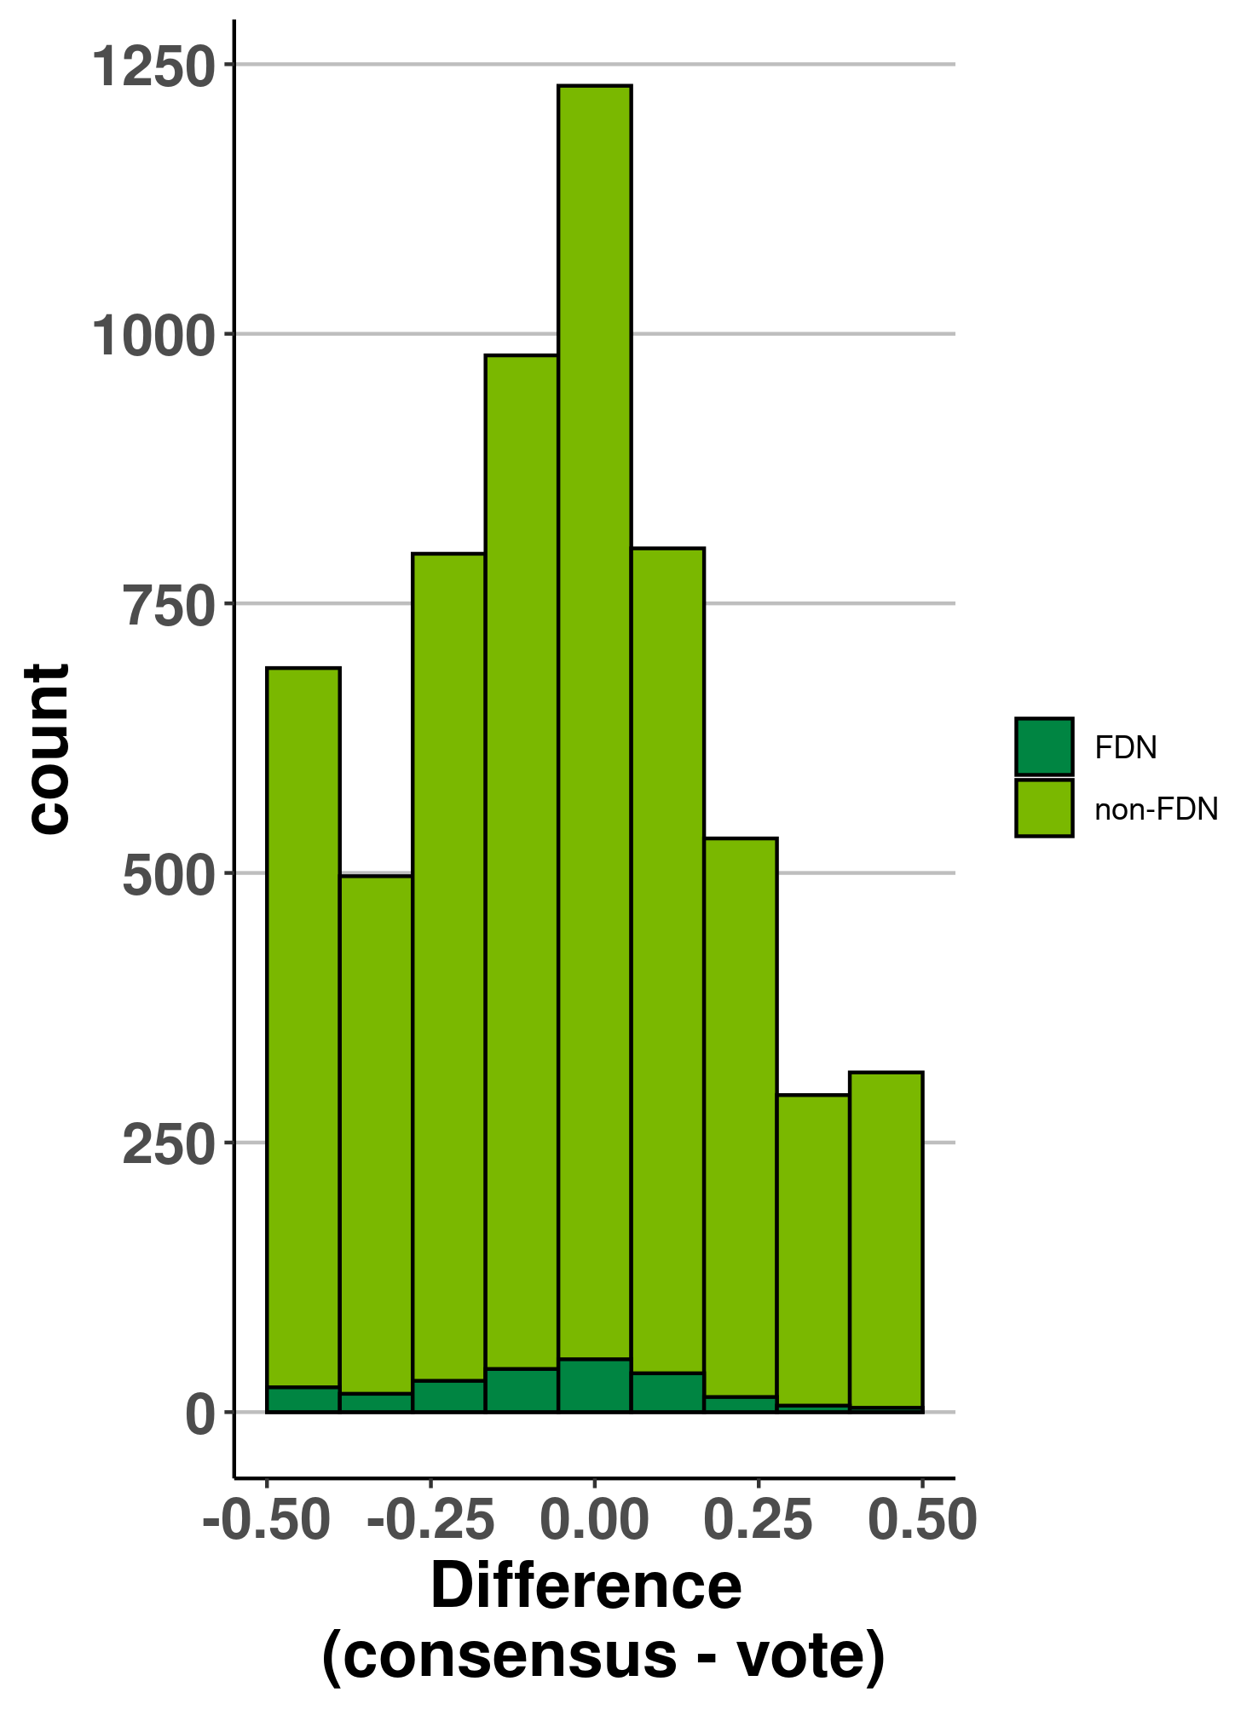
Figure I: Long description
| FDN_holder | bin | count |
|---|---|---|
| non-FDN | -0.444444444 | 690 |
| non-FDN | -0.333333333 | 497 |
| non-FDN | -0.222222222 | 796 |
| non-FDN | -0.111111111 | 980 |
| non-FDN | 0 | 1230 |
| non-FDN | 0.111111111 | 801 |
| non-FDN | 0.222222222 | 532 |
| non-FDN | 0.333333333 | 294 |
| non-FDN | 0.444444444 | 315 |
| FDN | -0.444444444 | 23 |
| FDN | -0.333333333 | 17 |
| FDN | -0.222222222 | 29 |
| FDN | -0.111111111 | 40 |
| FDN | 0 | 49 |
| FDN | 0.111111111 | 36 |
| FDN | 0.222222222 | 14 |
| FDN | 0.333333333 | 6 |
| FDN | 0.444444444 | 4 |
Figure J: Difference from consensus score (B&W)
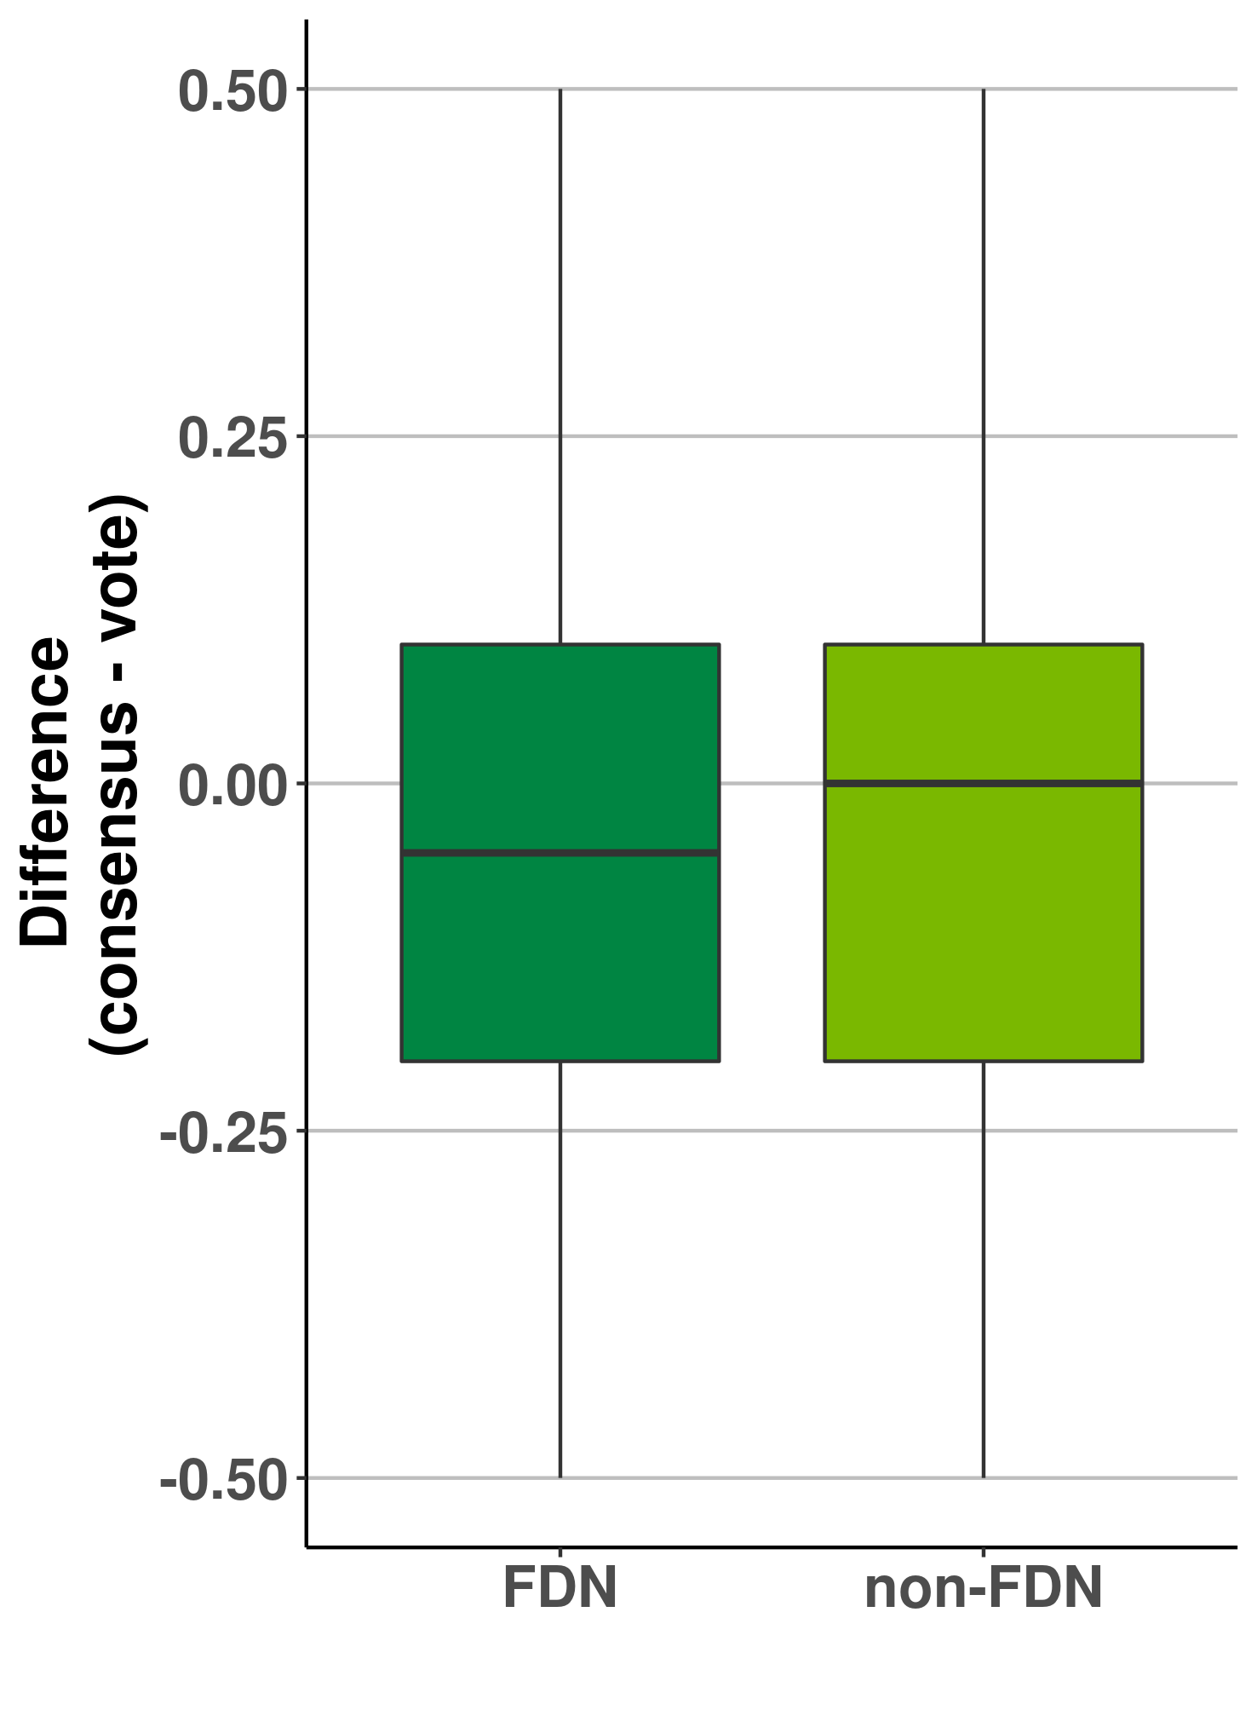
Figure J: Long description
| FDN_holder | median | Q1 | Q3 | min_whisker | max_whisker |
|---|---|---|---|---|---|
| FDN | -0.05 | -0.2 | 0.1 | -0.5 | 0.5 |
| non-FDN | 0 | -0.2 | 0.1 | -0.5 | 0.5 |
iv. Final scores
Applications from foundation holders received significantly higher final scores (p < 0.01)
Figure K: Final scores (Histogram)
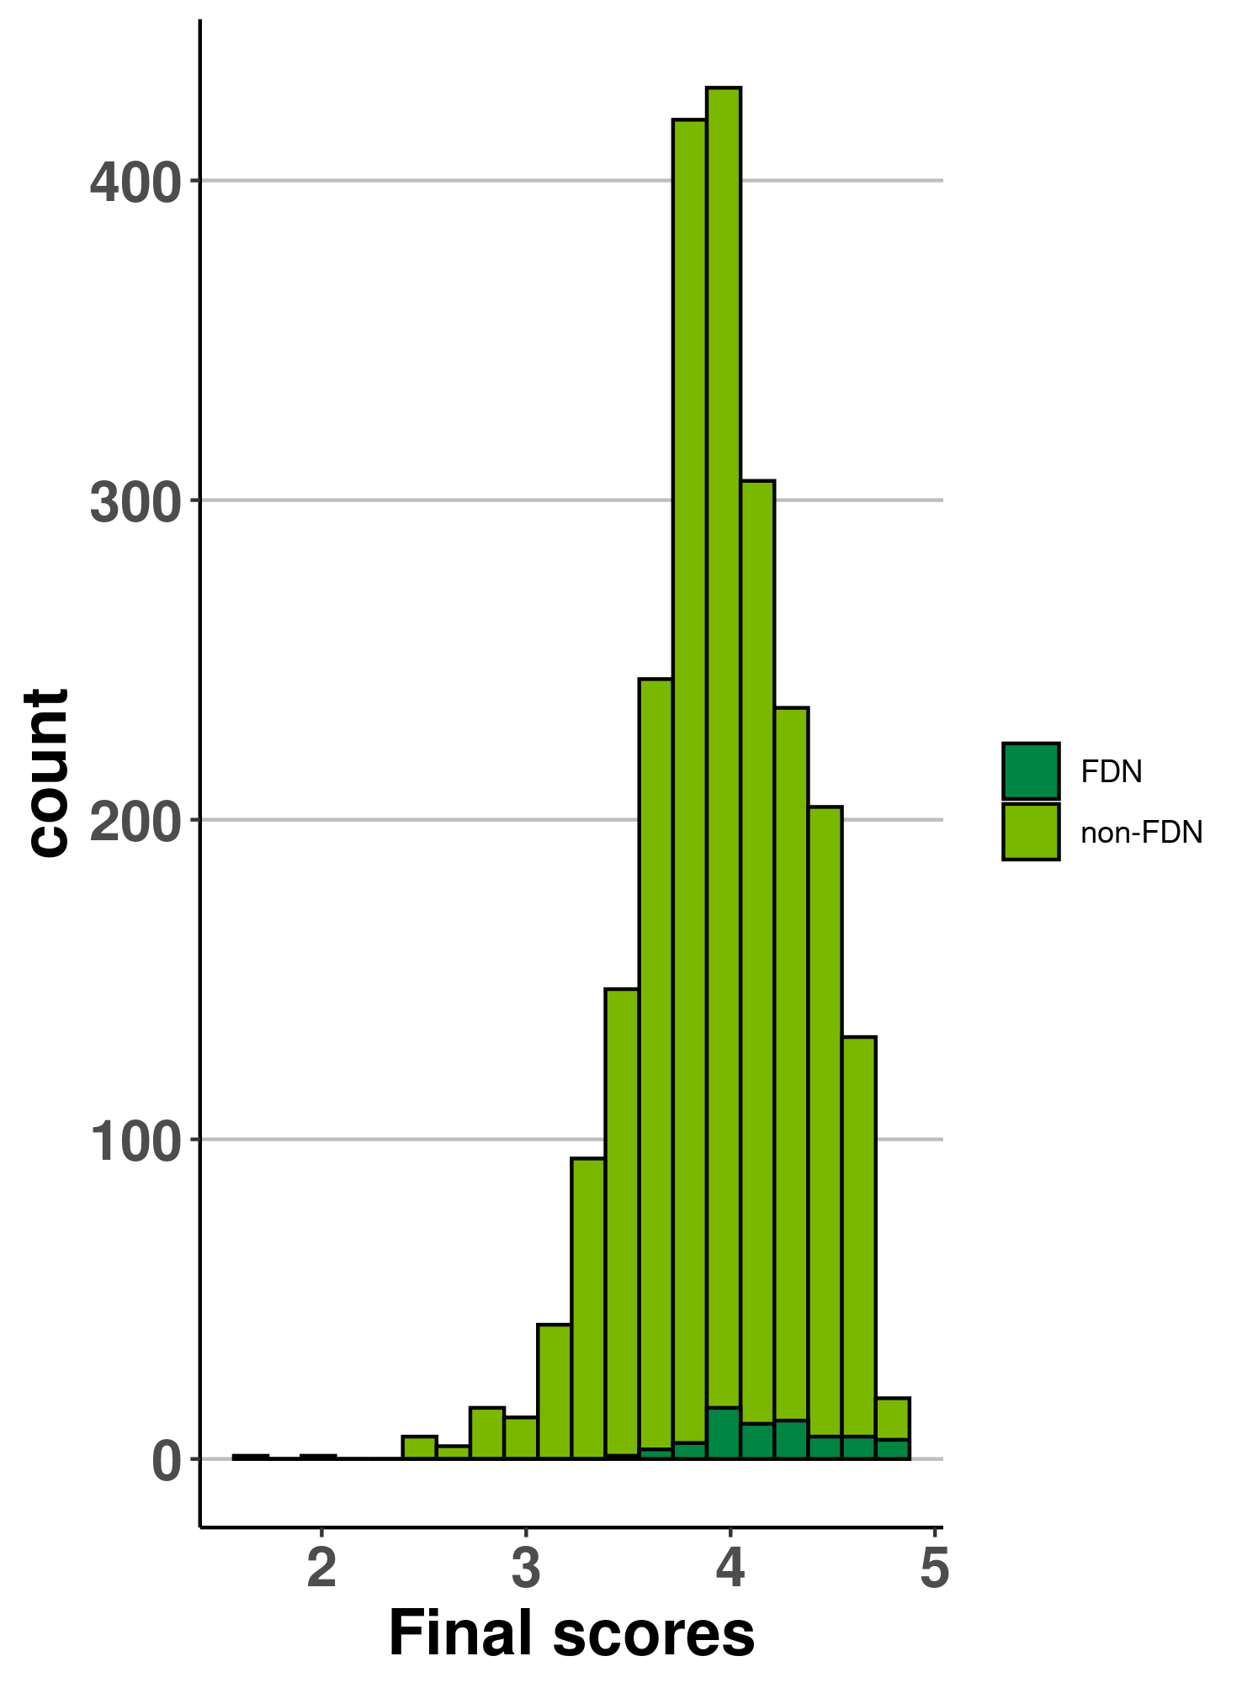
Figure K: Long description
| FDN_holder | bin | count |
|---|---|---|
| non-FDN | 1.652631579 | 1 |
| non-FDN | 1.817894737 | 0 |
| non-FDN | 1.983157895 | 1 |
| non-FDN | 2.148421053 | 0 |
| non-FDN | 2.313684211 | 0 |
| non-FDN | 2.478947368 | 7 |
| non-FDN | 2.644210526 | 4 |
| non-FDN | 2.809473684 | 16 |
| non-FDN | 2.974736842 | 13 |
| non-FDN | 3.14 | 42 |
| non-FDN | 3.305263158 | 94 |
| non-FDN | 3.470526316 | 147 |
| non-FDN | 3.635789474 | 244 |
| non-FDN | 3.801052632 | 419 |
| non-FDN | 3.966315789 | 429 |
| non-FDN | 4.131578947 | 306 |
| non-FDN | 4.296842105 | 235 |
| non-FDN | 4.462105263 | 204 |
| non-FDN | 4.627368421 | 132 |
| non-FDN | 4.792631579 | 19 |
| FDN | 1.652631579 | 0 |
| FDN | 1.817894737 | 0 |
| FDN | 1.983157895 | 0 |
| FDN | 2.148421053 | 0 |
| FDN | 2.313684211 | 0 |
| FDN | 2.478947368 | 0 |
| FDN | 2.644210526 | 0 |
| FDN | 2.809473684 | 0 |
| FDN | 2.974736842 | 0 |
| FDN | 3.14 | 0 |
| FDN | 3.305263158 | 0 |
| FDN | 3.470526316 | 1 |
| FDN | 3.635789474 | 3 |
| FDN | 3.801052632 | 5 |
| FDN | 3.966315789 | 16 |
| FDN | 4.131578947 | 11 |
| FDN | 4.296842105 | 12 |
| FDN | 4.462105263 | 7 |
| FDN | 4.627368421 | 7 |
| FDN | 4.792631579 | 6 |
Figure L: Final scores (B&W)
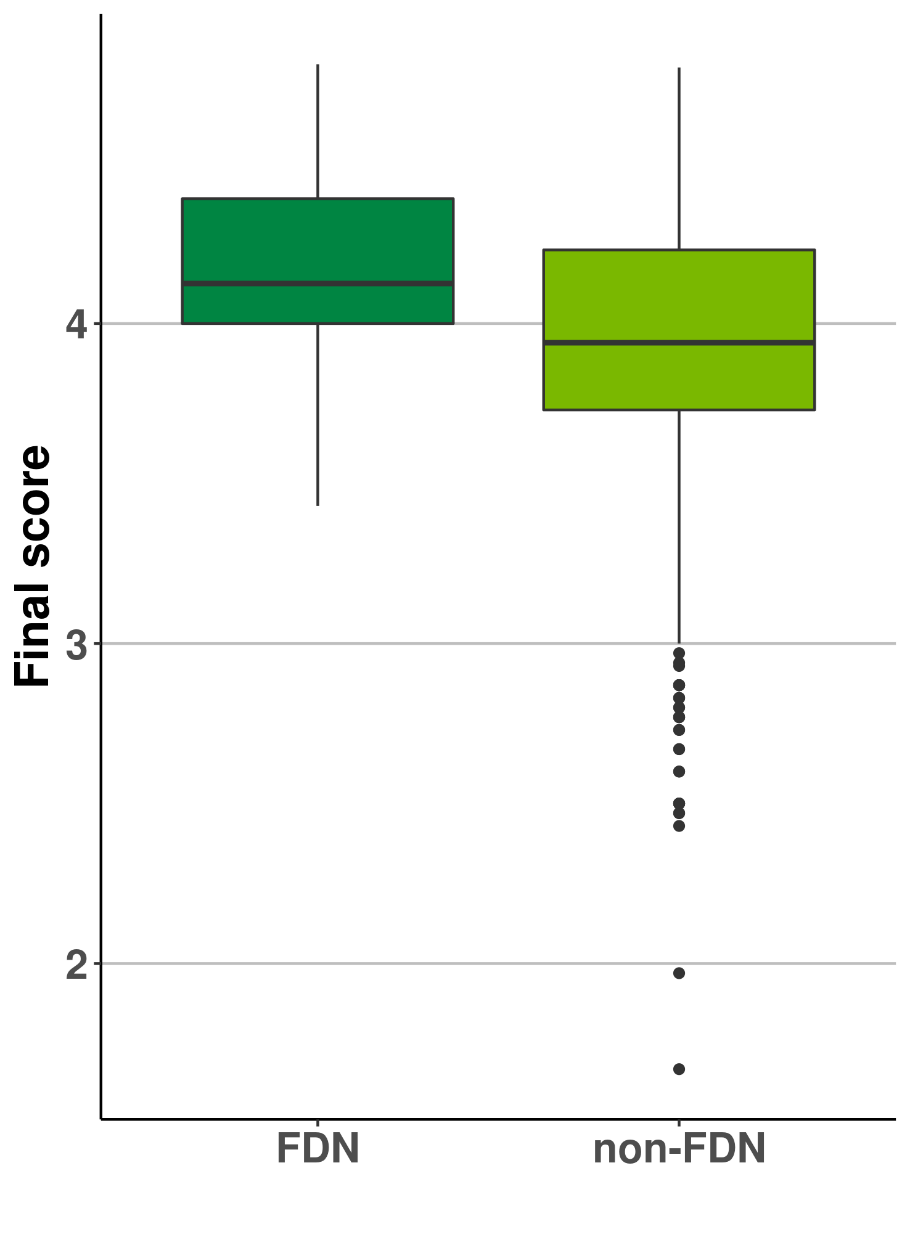
Figure L: Long description
| FDN_holder | median | Q1 | Q3 | min_whisker | max_whisker |
|---|---|---|---|---|---|
| FDN | 4.125 | 4 | 4.39 | 3.43 | 4.81 |
| non-FDN | 3.94 | 3.73 | 4.23 | 3 | 4.8 |
Large grants awarded
Large grants are defined as being in the top 2% of total requested grant value within a competition. In this competition, the cutoff for large grants was $2,340,000. A total of 47 applications fell into this category. A budget of $16.25M was available to fund those applications that are not from the Indigenous Health Research (IHR) panel. Large grants from the IHR panel are funded by IHR funds.
| Category | Number of applications | Percent of total applications submitted | Number of applications funded | Percent of applications funded | Success rate* | Average grant amount | Maximum grant amount |
|---|---|---|---|---|---|---|---|
| All large grants | 47 | 2% | 7 | 1.7% | 14.9% | $2,819,571 | $4,639,725 |
| Non-IHR large grants | 42 | 1.8% | 5 | 1.2% | 11.9% | $3,178,575 | $4,639,725 |
| *The success rate does not include priority announcements or bridge grants. | |||||||
Equalization
In order to ensure equal representation of certain demographics in the funded projects, we equalize the success rates for these groups. That means that the proportion of funded grants awarded to these groups is at least equal to the proportion of applications from these groups.
Early Career Researchers
The success rate for early career researchers (ECRs) is equalized. This means that the proportion of ECRs funded will not be less than the proportion of ECR applicants to the competition. This equalization is for the competition as a whole, not by committee.
The total number of fully funded projects for applicants in this career stage went from 90 (before equalization) to 110 (after equalization).
Indigenous Health Research
Based on the recommendation of the review committee, 14 Indigenous health research projects were awarded funding. CIHR is proud to support these projects as part of its commitment to invest 4.6% of its annual budget in Indigenous health research.
French applications
The success rate for applications submitted in French is equalized. This means that the proportion of French applications funded will not be less than the proportion of French applications to the competition. This equalization is for the competition as a whole, not by committee.
The total number of fully funded projects for applications in French went from 4 (before equalization) to 8 (after equalization).
Female applicants
The success rate for female applicants is equalized. This means that the proportion of female applicants funded will not be less than the proportion of female applicants to the competition. This equalization is for the competition as a whole, not by committee.
Female applicants did not require equalization in this competition so no direct action was taken to improve their success rate.
Bridge Grants and Priority Announcements
In addition to the 422 fully funded grants there were also 4 Bridge Grants totaling $400,000. There were 59 Priority Announcement grants funded for a total of $9,815,000 as well as 11 supplemental prizes for a total of $555,000.
Budget Size and Project Length
| Category | Average total budget | Change from historical (total budget) | Average duration (years) | Change from historical (duration) | Average annual amount | Change from historical (annual amount) |
|---|---|---|---|---|---|---|
| All Requests | $951,900 | -$5,741 | 4.22 | +0.22 | $221,352 | -$12,668 |
| Funded applications (requested) | $1,028,092 | +$8,801 | 4.38 | +0.31 | $229,534 | -$14,412 |
| Funded applications (awarded) | $770,003 | +$17,205 | 4.38 | +0.32 | $172,332 | -$8,625 |
Peer Review
Details about the Project Grant: Spring 2021 Peer review participants are available separately.
- Date modified: