Key considerations for sunsetting the Foundation Grant program
On April 15, 2019, Dr. Michael Strong announced CIHR’s decision to sunset the Foundation Grant program. To reach this decision, CIHR conducted a number of analyses of all completed Foundation Grant competitions, which revealed four main areas of concern: gender, age, institution size, and pillar of research. For comparison, these areas were also examined in the Project Grant program.
Gender
Data highlighted that there were issues with Stage 1 of the Foundation Grant program after the first two pilot competitions. CIHR therefore decided to intervene by equalizing the proportional success rates of female applicants by inviting additional female applicants to Stage 2 if necessary. While no corrective measures were needed for the 2016-17 competition, CIHR was required to take action for both subsequent competitions (2017-18 and 2018-19), which included the introduction of Unconscious Bias training for peer reviewers.
The issue clearly remained at Stage 1, where 75% of the score is based on the caliber of the applicant—meaning that peer reviewers were asked to give greater weight to their assessment of the person rather than the science. (Stage 2 assesses the quality of the research program, and the proportional success of female applicants remained steady at this stage.) Evidence suggests that women receive less favourable assessments using this evaluation methodology, and perpetually correcting this inequity at Stage 1 was not a solution that CIHR was willing to accept.
In the Project Grant program, by comparison, the proportions of funded men and women is relatively equal to the proportions of their application pressure. Further, the proportion of applications submitted by women is higher.
Figure 1, below, illustrates the proportional success rates of male and female applicants over multiple competitions (based on the percentage of applications submitted by each group vs. the percentage of applications funded in each group).
Figure 1: Applicants and grant holders by sex (2014-2018)
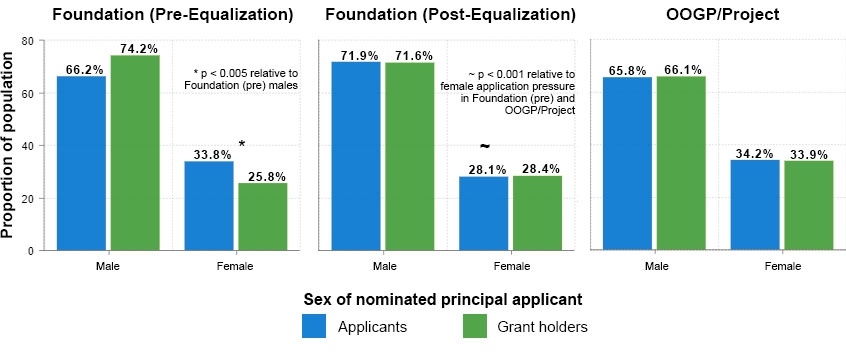
Figure 1 long description
| Proportion of population | ||||||
|---|---|---|---|---|---|---|
| Foundation (Pre-Equalization) |
Foundation (Post-Equalization) |
OOGP/Project | ||||
| Sex of nominated principal applicant | Applicants | Grant Holders | Applicants | Grant Holders | Applicants | Grant Holders |
| Male | 66.2% | 74.2% | 71.9% | 71.6% | 65.8% | 66.1% |
| Female | 33.8% | 25.8% | 28.1% | 28.4% | 34.2% | 33.9% |
Age
In terms of age, the data showed that Foundation Grants were awarded to a disproportionate number of older applicants. Although the applicant’s track record was an important component of the evaluation criteria for the program, the program was designed to support a broad base of research leaders across all areas and health-related disciplines. The Project Grant program data did not reveal the same issues with the distribution of grants—and, notably, the Project Grant program is open to independent researchers at all career stages.
Figure 2, below, shows the average age of grant recipients relative to application pressure.
Figure 2: Age of applicants and grant holders (2014-2018)
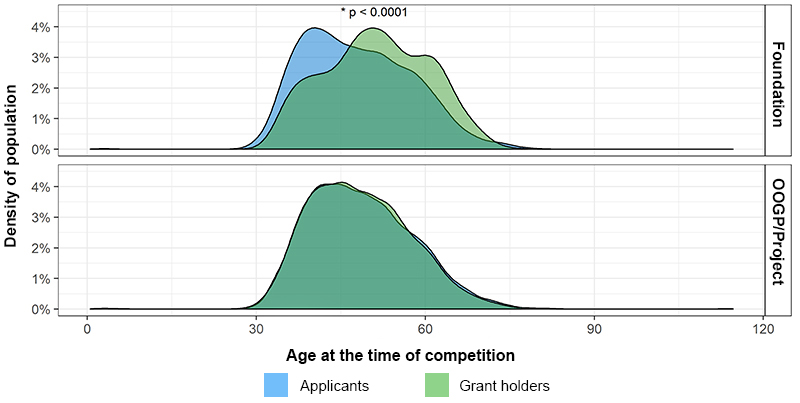
Figure 2 long description
Figure 2 shows the distribution of age of applicants and grant holders across several competitions of the Foundation and Project Grant programs. The Foundation Grant graph shows a significant shift towards older applicants (i.e., the proportion of people receiving Foundation grants are significantly older than the cohort that applied). The Project Grant graph shows that the age distribution is almost identical between applicants and grant holders.
Institution size
Much in the same way that disparities became evident in terms of applicant gender and age, multiple Foundation Grant competitions revealed that funding was awarded to a disproportionate number of applicants from larger institutions.
In the Project Grant program, applicants from smaller institutions have relatively proportional success in being funded.
Figure 3, below, shows the proportional application pressure and success rates of applicants from U15 and non-U15 institutions.
Figure 3: U15 status of applicant and grant holder institutions (2014-2018)
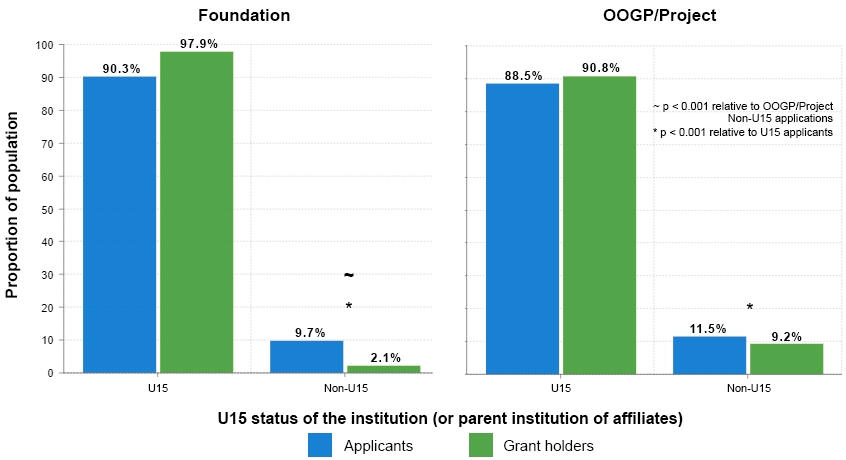
Figure 3 long description
| Proportion of population | ||||
|---|---|---|---|---|
| Foundation | OOGP/Project | |||
| U15 status of the institution (or parent institution of affiliates) |
Applicants | Grant Holders | Applicants | Grant Holders |
| U15 | 90.3% | 97.9% | 88.5% | 90.8% |
| Non-U15 | 9.7% | 2.1% | 11.5% | 9.2% |
Pillar of research
As originally envisioned, the Foundation Grant program was designed to support research leaders across all four pillars of health research. Over time, however, it became evident that biomedical (pillar 1) applications had disproportionately higher success rates than those from other pillars.
In Project Grant competitions, by comparison, the proportions of applications funded by pillar are relatively equal to the proportions of their application pressure.
Figure 4, below, shows the proportional application pressure and success rate by pillar for multiple competitions.
Figure 4: Pillar of applicant and grant holders (2014-2018)
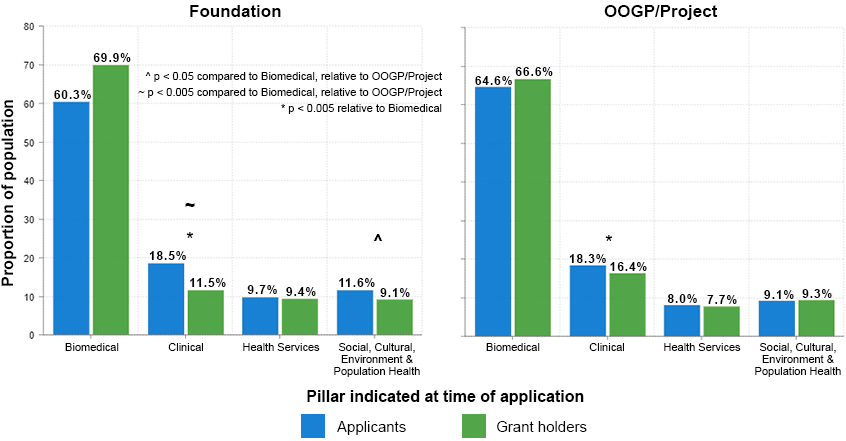
Figure 4 long description
| Proportion of population | ||||
|---|---|---|---|---|
| Foundation | OOGP/Project | |||
| Pillar indicated at time of application | Applicants | Grant Holders | Applicants | Grant Holders |
| Biomedical | 60.3% | 69.9% | 64.6% | 66.6% |
| Clinical | 18.5% | 11.5% | 18.3% | 16.4% |
| Health Services | 9.7% | 9.4% | 8.0% | 7.7% |
| Social, Cultural, Environment & Population Health | 11.6% | 9.1% | 9.1% | 9.3% |
Discussions about the data analyses led CIHR’s senior management, Science Council, and Governing Council to the conclusion that adjusting the Foundation Grant program design (or introducing course corrections for an individual competition) would not be sufficient to address these areas of concern.
- Date modified: